Data-Driven Introspection
1. I am 22% happier on average during days where I hang out with friends
Throughout my trip, I met up with friends who were around the same area. This insight is based on an arbitrary scale from 1 to 5. Despite being arbitrary, a t-test shows that the difference was statistically significant(p-value=0.005), meaning that I’m significantly happier when I see friends.
It’s worth noting that this result is an average. I’ve had bad days with friends, and good days alone. This insight does suggest that I’m an extrovert on an average day.
2. My iPhone camera usage time is correlated with my happiness


Although a causation is unlikely, there are several plausible explanations for this. If I’m having a good time, I may have had a tendency to capture a photo of the moment. After all, it’s nice to relive those moments through a photo sometime in the future. My future self will thank me for that.
Alternatively, using my iPhone camera is fun, and fun things make me happy. This wouldn’t be surprising given that I enjoy taking photos of people and places.
3. Coffee and other diuretics cause me to use the restroom 21% more


Everybody’s bodies react differently to diuretics. I didn’t understand the detailed effects on my body, so I was curious to see through data how it could affect my day. Based on the results, it turns out that it does have a significant affect on my habits during the day.
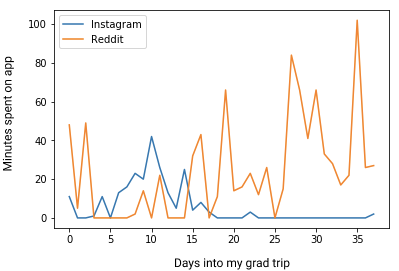
4. Less Instagram = More Reddit


One of my goals for my grad trip was to reduce my social media consumption. This meant cutting down on Facebook, Instagram, and more. It’s a known fact that habits can only be replaced. Here’s that fact shown above in data.
To clarify, Reddit wasn’t the only thing that I spent my time doing. I often took breaks at coffee shops to read books, Quora, or sipping on a coffee. That said, prior to my grad trip, I rarely used Reddit which was why the increased usage was so interesting.
And so much more…
There’s a plethora of other types of analysis that can be done on the data, which made this project all the more fun. Although these insights don’t provide a comprehensive answer to the original question, it’s a step forward.
Methodology
To answer my original question, I needed to collect data. A week prior to my trip, I wrote down a list of measurable things about myself. For example:
- How happy I felt (from 1–5)
- How many minutes I spent on X app
- How many times I used the washroom
- How much did I spend
- Etc.
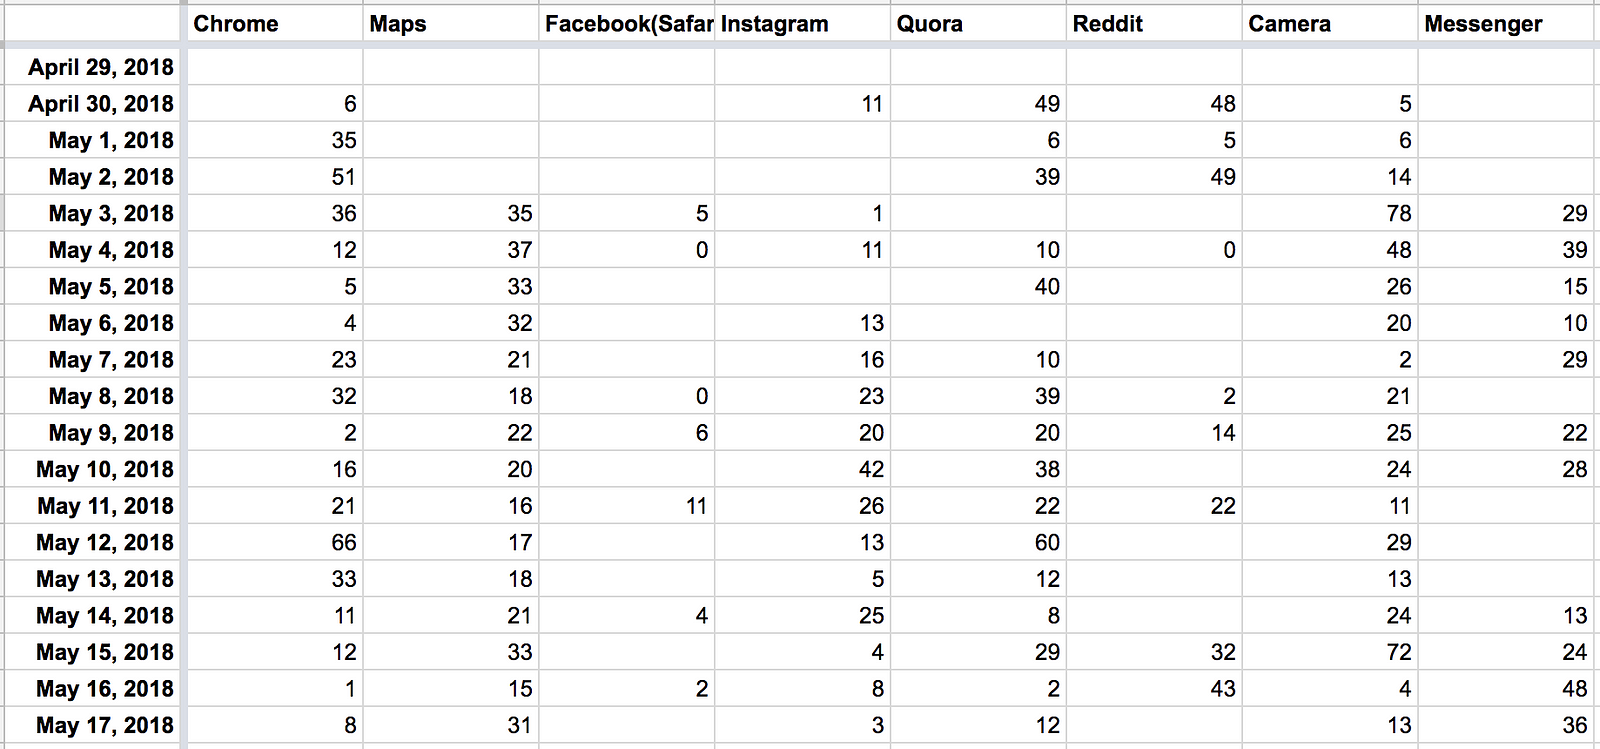
Each day during my trip, I summarized the day’s data into a spreadsheet. Here’s an example of what my app usage spreadsheet page looked like:


At the end of my trip, I processed all of this data to answer the aforementioned question using Jupyter Notebooks. To calculate significance, I ran one-way ANOVA’s or a Pearson correlation coefficient over 38 samples (38 days).
