Network traffic monitoring for your mobile apps
Network traffic monitoring for your mobile apps
In this post we’ll make a brief review of possible ways to analyse the network traffic generated by your app and connected libraries using default logging tools and external proxies. This topic was inspired by the unexpectedly large interest to the network activity monitoring section of my last
Use the debug output from your HTTP client library
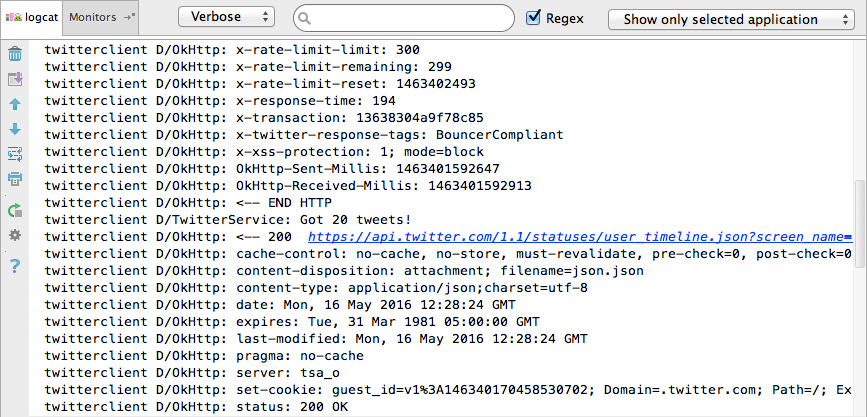
The most common and obvious way is to use the log output from your HTTP client library. So let’s assume that you are using Retrofit, but the same is relevant for the most of other libraries available. To get all network sent/received data printed in the console you should set LogLevel.FULL


If you are using the default console configuration for Android Studio you will lose all the output you had before after re-deploying the app. It happens because by default Android Monitor connects to the debugged app by the process id
But there are several issues left:
- If you are going to keep full network logging enabled during the development process you will note that performance of the app decreased. The reason: on this logging mode the network output won’t be parsed as an InputStream immediately when it was received (Jake Wharton’s comment), but will be blocked while all api response data will be received from the server. Console print operation also takes some time.
- If your app has some external libraries using network for their needs (for example Google Analytics) — of course you can also enable console logging there but can you be sure that all triggers needed are enabled and data has been sent to the server?
- During the QA it is not always possible to have access to the console output or it could be inconvenient for some members of your team.
Use proxying tools
The idea of proxying could be described as a tool in the middle of client and server which can read, log, modify or block some parts of the traffic being sent between client and server. So it doesn’t affect your application configs and logging options and can be used for blackbox testing and debugging.
The configuration of the test device to pass data through the proxy server usually should follow these steps:
- IP address and port of the proxy should be set as a proxy server address on the client device.
- If the proxy can be used as man-in-the-middle HTTPS proxy and you are going to track secured traffic — install SSL certificate provided by proxy tool.
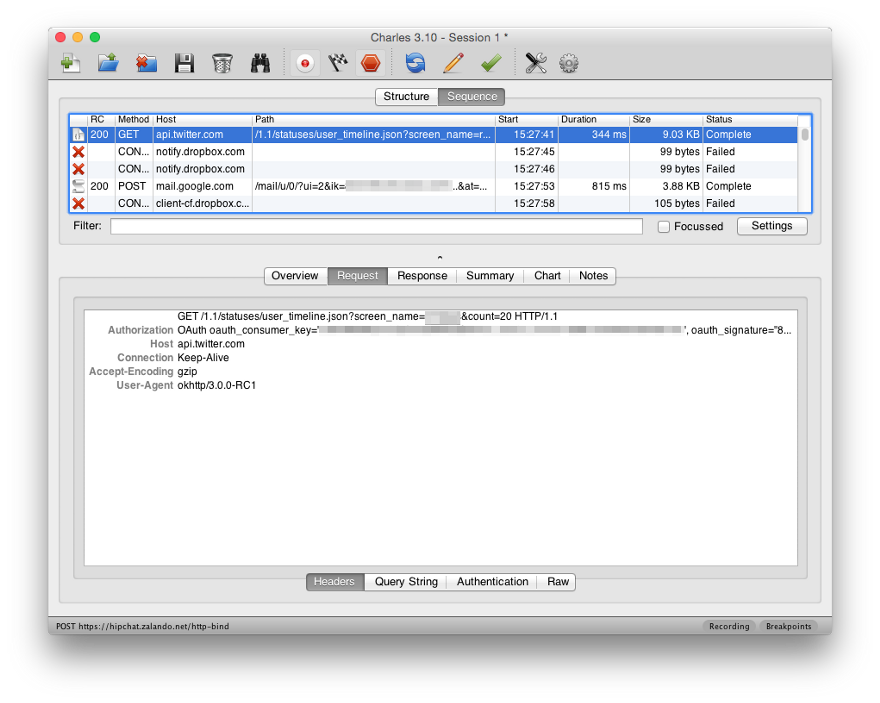
The perfect fit for our team is Charles HTTP proxy. It allows to read SSL traffic, log all network calls and modify/re-execute api calls if needed.


Amazing video tutorial about Charles setup on Mac with Android Genymotion emulator was made by Andy Merrill and posted on YouTube, you can watch it below. Another short guide will show you how to configure SSL proxying in Charles.
Another nice review of mobile traffic monitoring tools with a focus on using Burp Suite application and Runscope cloud-based proxy could be found on this website.
Conclusion
In this post we checked the options available for the developer to do network monitoring of the mobile app. We saw constraints of console-output approach and when & how to use HTTP proxying tools. The information provided was focused mainly on Android developer needs but it’s also relevant for developers working for other platforms.
Update. As mentioned in comments another alternative for network traffic monitoring could be Facebook Stetho. It won’t allow you to read traffic from the production but could be a good solution for the regular dev needs. Also I haven’t found the way to read SSL encrypted traffic from Google Analytics using Stetho, please drop me a message if you know something about it.
Update 2. Firebase Analytics team has recently announced DebugView mode which can a be a game changer in debugging of analytics output. This tool is integrated to Firebase console and shows real-time tracking events coming from the selected device. Looking forward to see it available for developers.
