
TensorBoard 計算圖的視覺化
阿新 • • 發佈:2019-01-02
簡介
tensorflow 配套的視覺化工具, 將你的張量圖畫出來.
當訓練一個巨大的網路的時候, 計算圖既複雜又令人困惑. TensorBoard 提供了一系列的元件, 可以看到 learning rate 的變化, 看到 objective function 的變化.
tfboard 讀取 tf 執行時你記下的 events files, 來進行視覺化. 這些 events files 包含了你記下的 summary data, 它是 protobuffer 格式, 並非文字檔案.
搭配 Estimator 使用
推薦使用 風格.
類與方法
tensorflow.python.summary.writer.writer.FileWriter(SummaryToEventTransformer)
類.
__init__(self, logdir, graph=None,...)
建構函式, Creates aFileWriterand an event file.tensorflow.python.summary.summary
模組.scalar(name, tensor, ..)
Outputs aSummaryprotocol buffer containing a single scalar value.image(name, tensor, max_outputs=3, collections=None, family=None)
Outputs aSummaryprotocol buffer with images.
images are built fromtensorwhich must be 4-D with shape[batch_size, height, width, channels]and wherechannelscan be:
- 1-
tensoris interpreted as Grayscale. - 3-
tensoris interpreted as RGB. - 4-
tensoris interpreted as RGBA.
- 1-
histogram(name, values, collections=None, family=None)
Adding a histogram summary makes it possible to visualize your data’s distribution in TensorBoard.
開啟web頁面
在命令列中 敲tensorboard --logdir=D:\tf_models\iris, 根據提示開啟URL即可.
比如我的為http://yichu-amd:6006/.
效果截圖
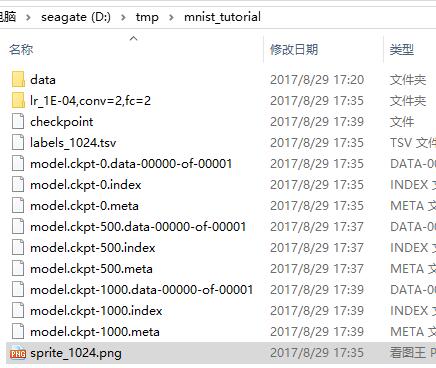
圖3-1 logdir中的檔案
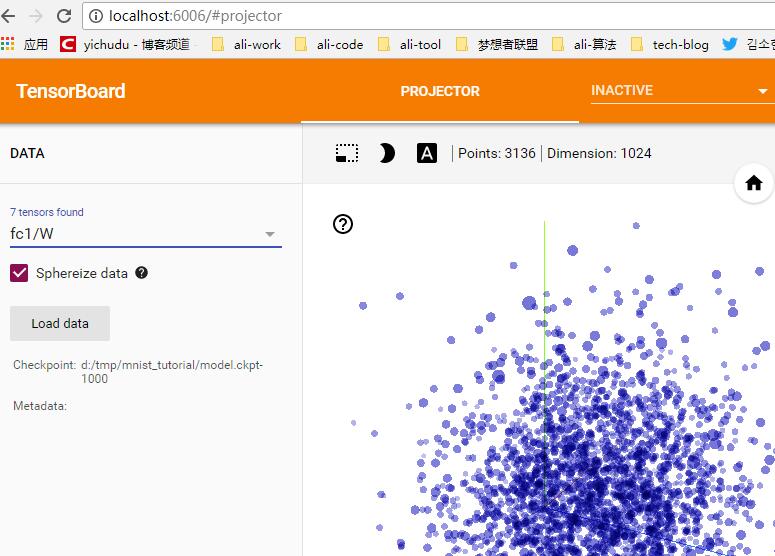
圖3-2 炫酷的視覺化效果

figure 3 計算圖的視覺化