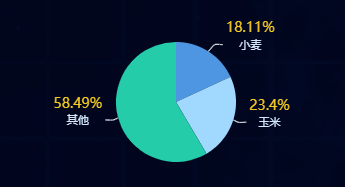
echarts餅圖常用配置項
阿新 • • 發佈:2019-01-03

 let myChart2 = this.$echarts.init(
        document.getElementById("Index-echart")
      );
      myChart2.setOption({
        color: ["#4F96E2", "#A0D8FE", "#24CCA9"], //餅圖顏色
        series: [
          {
            type: "pie", //這裡設定成“pie”就是餅圖,“bar”是柱狀圖,“line”是折線圖
            radius: "50%",
            selectedMode: "single", //支援單個選中
            data: [
              { value: 1548, name: "小麥" },
              { value: 2000, name: "玉米" },
              { value: 5000, name: "其他" }
            ],
            label: {
              normal: {
                formatter: "{per|{d}%}\n{a|{b}}\n{hr|}", //百分比之後換行顯示文字
                rich: {
                  a: {
                    color: "#D4E8FD",  //文字顏色
                    fontSize: 11,   //文字大小
                    lineHeight: 20,  //間距
                    align: "center"  //文字居中
                  },
                  per: {
                    color: "#F5CB22",  //百分比文字顏色
                    align: "center",
                    fontSize: 14
                  }
                }
              }
            },
            labelLine: {
              normal: {
                lineStyle: {
                  color: "#e2e8ed"  //指向線顏色
                },
                smooth: 0.2,  //線的拐彎程度
                length: 8,  //第一條線長度
                length2: 8,  //第二條線長度
                length3: 8  //第三條線長度
              }
            },
          }
        ]
      });
