視覺化庫-seaborn-佈局風格設定(第五天)
阿新 • • 發佈:2019-01-09
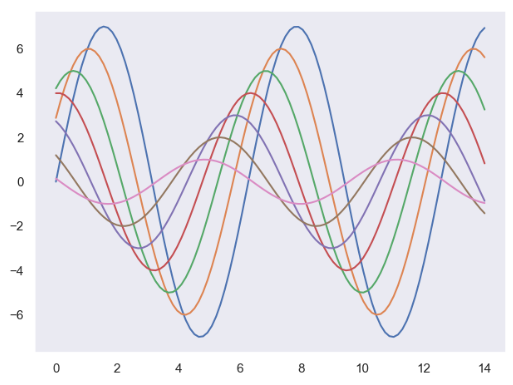
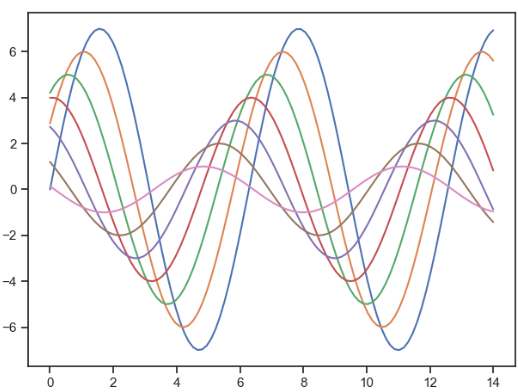
1. sns.set_style() 進行風格設定, sns.set() 進行設定的重置,
五種風格
# 1.darkgrid
# 2.whitegrid
# 3.dark
# 4.white
# 5 ticks
import seaborn as sns import numpy as np import matplotlib.pyplot as plt # 定義基本繪圖函式 def sinplot(flip=1): x = np.linspace(0, 14, 100) for i in range(7): plt.plot(x, np.sin(x+i*0.5) * (7-i))# 重置風格 sns.set() sns.set_style('darkgrid') sinplot() plt.show()



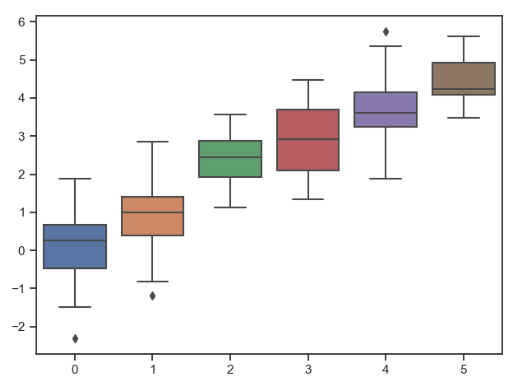
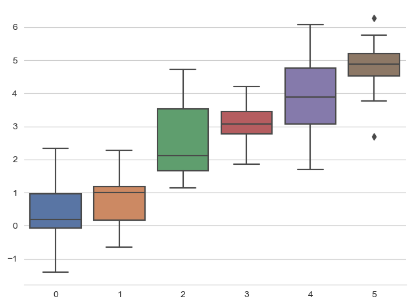
2. 使用sns.boxplot 繪製盒圖
data = np.random.normal(size=(20, 6)) + np.arange(6)
sns.boxplot(data=data)
plt.show()
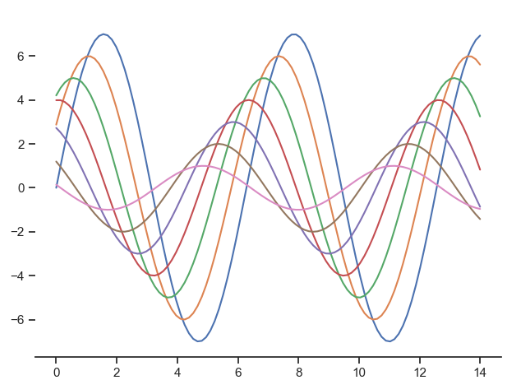
3. sns.despine(left=True) 去除左邊的框圖
sns.set_style('ticks')
sinplot()
sns.despine(left=True)
plt.show()
4. 風格細節設定, sns.violinplot畫小提琴圖, despine(offset=10)表示距離座標軸的位置
sns.violinplot(data=data)
sns.despine(offset=10)
plt.show()
5. sns.boxplot(pattle='deep') pattle 設定顏色的風格,通過對sns.deepine() 對顏色的邊框進行去除
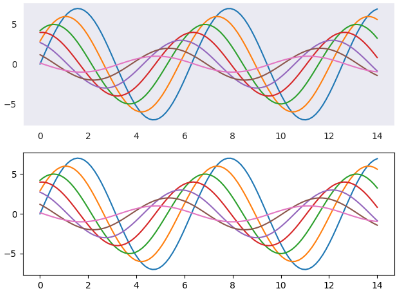
6. 指定不同的風格, 使用 with sns.axes_style('dark')
with sns.axes_style('dark'):
    plt.subplot(211)
    sinplot()
plt.subplot(212)
sinplot(-1)
plt.show()
7. 指定畫板的大小 sns.set_text() 指定風格大小
#1 paper
#2 talk
#3 poster
#4 notebook
sns.set_context('paper')
plt.figure(figsize=(8, 6))
sinplot()
plt.show()

8. 在sns.set_context的基礎上, font_scale 指定裡面字型大小,rc={'lines.linewidth':2.5} # 指定曲線的粗細
sns.set('notebook', font_scale=1.5, rc={'lines.linewidth':2.5})
sinplot()
plt.show()

