
cesium學習記錄(-)- 視覺化空間資料Entity入門基礎
視覺化空間資料
This tutorial will teach you how to use Cesium’s Entity API for drawing spatial data such as points, markers, labels, lines, models, shapes, and volumes. No prior knowledge of Cesium is needed, but if you have absolutely no experience with it, you might want to start with our first tutorial
本教程將教會你如何是使用Cesium 的Entity API 來繪製空間資料,諸如:points, markers, labels, lines, models, shapes以及volumes。本教程完全不需要您有關於Cesium 的知識儲備,但是如果您是完全沒有經驗,您可以試著從我們最簡單的demo 開始學習。Cesium up and running。
什麼是Entity API
Cesium has a rich API for spatial data that can be split into two categories:
a low-level API geared towards graphics developers, commonly referred to as the Primitive API, and a high-level API for data-driven visualization, referred to as the Entity API.
cesium 包含了豐富的API文件,主要分成了兩大類:一類是面向圖形開發人員低層次API,通常我們稱他為Primitiva API。另外一類是驅動資料視覺化的高層次API,我們稱他們為Entity API。
The Primitive API’s primary goal is to expose the minimal amount of abstraction needed to perform the task at hand. It expects us to think like a graphics programmer and uses graphics terminology. It is structured to provide the most performant and flexible implementation for a given visualization type, not for API consistency. Loading a Model is different from creating a Billboard and both are radically different from creating a Polygon. Each type of visualization is its own distinct feature. Furthermore, they each have different performance characteristics and require different best practices to be followed. While it is powerful and flexible, most applications are better served with a higher level of abstraction than what is offered by the Primitive API.
Primitive API的主要目標是公開完成手頭任務所需的最小抽象量。它期望我們像圖形程式設計師一樣思考,並使用圖形術語。它的結構是為給定的視覺化型別提供最高效能和靈活的實現,而不是為了API的一致性。載入一個模型與建立一個廣告牌不同,兩者都與建立一個多邊形截然不同。每種型別的視覺化都是它自己獨特的特性。此外,它們各自具有不同的效能特徵,需要遵循不同的最佳實踐。雖然它強大而靈活,但是大多數應用程式的抽象級別比Primitive API提供的抽象級別更高。
The goal of the Entity API is to expose a set of consistently designed high-level objects that aggregate related visualization and information into a unified data structure, which we call an Entity. It lets us concentrate on the presentation of our data rather than worrying about the underlying mechanism of visualization. It also provides constructs for easily building complex, time-dynamic visualization in a way that fits naturally alongside static data. While the Entity API actually uses the Primitive API under the hood, that’s an implementation detail we will (almost) never have to concern ourselves with. By applying various heuristics to the data we give it, the Entity API is able to provide flexible, high-performance visualization while exposing a consistent, easy to learn, and easy to use interface.
Entity API的目標是公開一組一致設計的高階物件,這些物件將相關的視覺化和資訊聚合到一個統一的資料結構中,我們稱之為Entity。它讓我們專注於資料的呈現,而不是擔心視覺化的底層機制。它還提供了一些構造,以方便地構建複雜的、時間動態的視覺化,這與靜態資料很自然地吻合。雖然Entity API實際上使用了底層API,但這是我們將(幾乎)永遠不用關心的實現細節。通過對我們提供的資料應用各種各樣的啟發式方法,Entity API能夠提供靈活的、高效能的視覺化,同時公開一個一致的、易於學習的、易於使用的介面。我們的第一個Entity 程式
One of the best ways to learn the basics of the Entity API is by looking at some code. In order to keep things simple, we’re going to build on the Hello World example in Cesium Sandcastle. If you are set up to develop with Cesium locally, feel free to use your own application instead.
學習Entity 的最有效的方法是試著就看一寫程式碼。為了使得這一切變得很簡單我們將會在Cesium 的Sandcastle 下建立Hello World example以方便學習者的檢視。如果您本地已經安裝了Cesium的執行環境,可以嘗試著在自己的應用程式上做簡單的開發試驗。
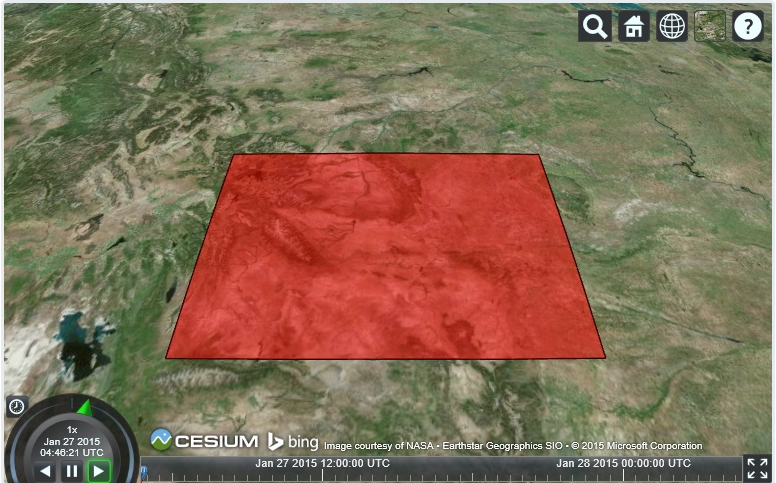
Suppose we wanted to add a polygon for the US state of Wyoming from a list of longitude and latitude degrees. (Wyoming was chosen because it’s such a simple polygon.) We can copy and paste the below code into Sandcastle to do it:
假設我們想要從經度和緯度的列表中為美國懷俄明州新增一個多邊形。(之所以選擇懷俄明州,是因為它是一個簡單的多邊形。)我們可以將下面的程式碼複製貼上到Sandcastle中去做:
例項一:
var viewer = new Cesium.Viewer('cesiumContainer');

var wyoming = viewer.entities.add({
  name : 'Wyoming',
  polygon : {
    hierarchy : Cesium.Cartesian3.fromDegreesArray([
                              -109.080842,45.002073,
                              -105.91517,45.002073,
                              -104.058488,44.996596,
                              -104.053011,43.002989,
                              -104.053011,41.003906,
                              -105.728954,40.998429,
                              -107.919731,41.003906,
                              -109.04798,40.998429,
                              -111.047063,40.998429,
                              -111.047063,42.000709,
                              -111.047063,44.476286,
                              -111.05254,45.002073]),
    height : 0,
    material : Cesium.Color.RED.withAlpha(0.5),
    outline : true,
    outlineColor : Cesium.Color.BLACK
  }
});

viewer.zoomTo(wyoming);·············
 ·
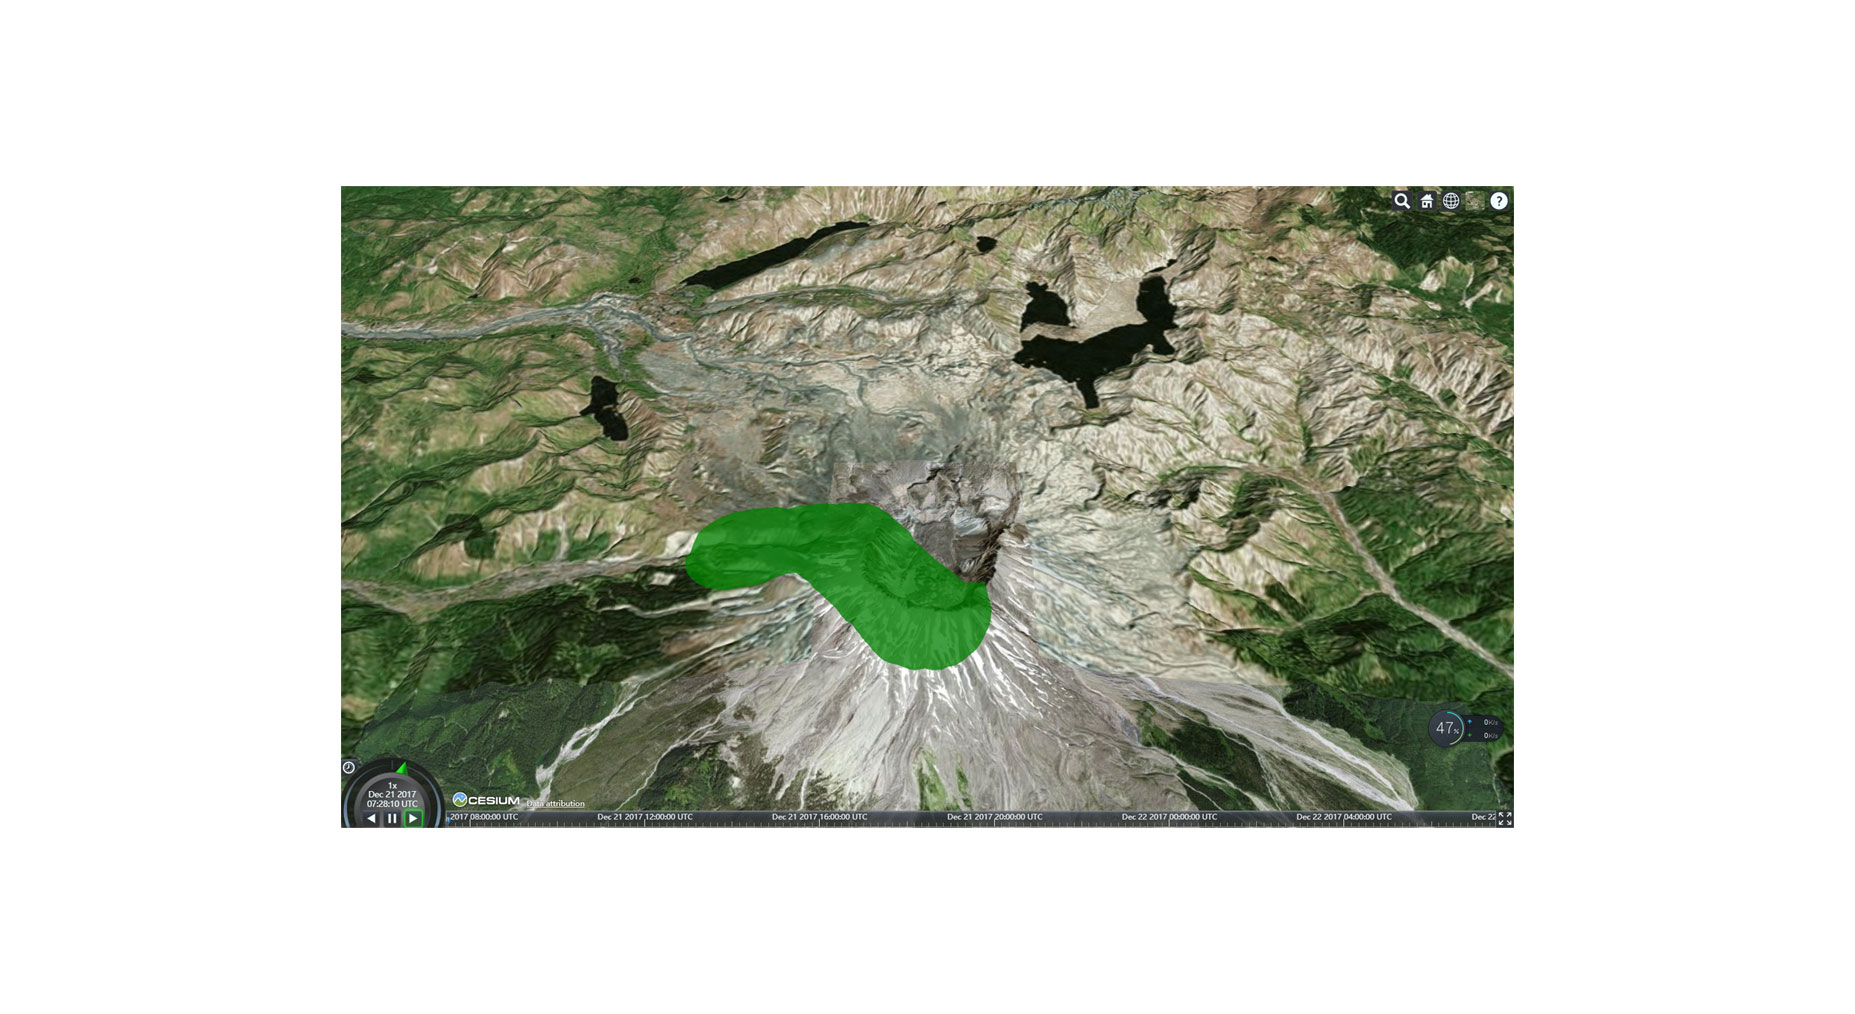
·例項二:
HTML code:
 <script src="../../Build/Cesium/Cesium.js"></script>

    <script src="../Sandcastle/Sandcastle-header.js"></script> <script src="../Sandcastle/Sandcastle-client.js"></script>
  <style>
      @import url(../../Build/Cesium/Widgets/widgets.css);
      @import url(../../Apps/Sandcastle/templates/0.css);

      html, body, #cesiumContainer {
          width: 100%; height: 100%; margin: 0; padding: 0; overflow: hidden;
      }
  </style>


</head>
<body>
<div id="cesiumContainer" class="fullSize"></div>
<div id="loadingOverlay"><h1>Loading...</h1></div>
<div id="toolbar">
    <div id="terrainMenu"></div>
    <div id="zoomButtons"></div>
    <div id="toggleLighting"></div>
    <div id="sampleButtons"></div>
</div>

<script>
javascript code:
Cesium.BingMapsApi.defaultKey = 'Amw_FMqlQLZHtp9ZnOmDqVvJ1QBQTNZbRHOq7d2pqj5yQ0fxJsSNof_obeEl8qbU';
      var viewer = new Cesium.Viewer('cesiumContainer');

      var cesiumTerrainProvider = new Cesium.CesiumTerrainProvider({
          url : 'https://assets.agi.com/stk-terrain/v1/tilesets/world/tiles',
          requestWaterMask : false,
          requestVertexNormals : true
      });

      viewer.terrainProvider = cesiumTerrainProvider;
      viewer.scene.globe.depthTestAgainstTerrain = true;


      var e = viewer.entities.add({
          corridor : {
              positions : Cesium.Cartesian3.fromDegreesArray([
                  -122.19, 46.1914,
                  -122.21, 46.21,
                  -122.23, 46.21
              ]),
              width : 2000.0,
              material : Cesium.Color.GREEN.withAlpha(0.5)
          }
      });
      viewer.zoomTo(e);

      Sandcastle.reset = function () {
          viewer.entities.removeAll();
      };
編譯執行之後的效果:
Since one of our goals is to make Cesium code easy to understand, hopefully the above is self explanatory. We create the Viewer widget, which serves as the base for almost all Cesium applications, and then add a new Entity via viewer.entities.add. The object we pass to add is just an options parameter which provides initial values. The return value is the actual entity instance. Finally, we call viewer.zoomTo to make sure the entity is in view.
因為我們的目標之一是讓Cesium程式碼易於理解,希望上面的程式碼是不言而喻的。我們建立了Viewer小部件,它是幾乎所有的Cesium應用程式的基礎,然後通過Viewer.enti.add新增一個新的Entity。我們傳遞給新增的物件只是一個選項引數,它提供初始值。返回值是實際的Entity例項。最後,我們呼叫viewer.zoomTo以確保實體在檢視中。
There are an incredible amount of Entity options available, but for now we specify translucent red for the interior of the polygon and a black outline for the border. We also give the entity a display name of “Wyoming”.
實際上Entity 有很多的引數可以用,但是我們現在只是提供了一個內紅外面是黑邊的輪廓。我們也給了這Entity個顯示名稱“Wyoming”。
相關推薦
cesium學習記錄(-)- 視覺化空間資料Entity入門基礎
視覺化空間資料 This tutorial will teach you how to use Cesium’s Entity API for drawing spatial data such as points, markers, labels, lines, m
cesium學習記錄(二)- 視覺化空間資料Viewer 中的Entity
Unless we specifically disable it, clicking on an entity in the Viewer will show the SelectionIndicator widget at the Entity’s location
Cesium 學習記錄(5)一次刷新出多個自定義氣泡視窗
之前文章被抄襲過,抄襲者我就說一句好自為之,現在csdn沒辦法舉報和投訴,有時間了我絕對追究到底歡迎轉載,不歡迎一個字不改還說自己是原創的。樂於知識分享,轉載請註明原作者和地址,謝謝。==============================================
機器學習筆記(二十):TensorFlow實戰十二(TensorBoard視覺化)
1 - 引言 前面已經介紹到TensorFlow可以實現許多非常常用的神經網路結構,有的網路結構十分複雜,裡面的引數關係更是難以管理。因此,TensorFlow提供了一個視覺化工具TensorBoard。可以有效的展示執行過程中的計算圖、各種指標隨著時間的變化趨勢以及訓練中使用到的影象等
資料視覺化-------------------------------------下載資料學習(一)
下載資料,並進行視覺化分析,以下學習兩種格式的資料:1.CSV,對應的使用Python模組的CSV模組來處理CSV檔案,2.json.對應使用json模組處理資料。 1.CSV檔案格式 CSV檔案是一系列的以逗號分割的資料,這樣利於程式提取資料。來做一個關於天氣的資料分析 import
深度學習框架tensorflow學習與應用9(tensorboard視覺化)
import tensorflow as tf from tensorflow.examples.tutorials.mnist import input_data from tensorflow.contrib.tensorboard.plugins import projector # In
Caffe學習筆記(4) -- 視覺化訓練結果
注:本文為基於微軟的Windows Caffe Caffe提供了一個視覺化訓練結果的工具,下面就是具體的操作方法 caffe的根目錄下文統一定義為CAFFE_ROOT 首先,預設情況下執行caff
(GIS視覺化)ArcGis中屬性連線、關聯和空間連線的區別
1.連線(join) 1.1概念 為將不同型別的資訊放在一起,通常將多個數據表組合在一起,或者稱為連線在一起。公共欄位、暫時的關係。 源表:包含要追加資訊的表。 目標表:接收追加資訊的表。 1.2對應關係 目標表對源表: 一對一
《TensorFlow學習筆記》卷積神經網路CNN實戰-cifar10資料集(tensorboard視覺化)
IDE:pycharm Python: Python3.6 OS: win10 tf : CPU版本 程式碼可在github中下載,歡迎star,謝謝 CNN-CIFAR-10 一、CIFAR10資料集 資料集程式碼下載 from te
深度學習(二十七)視覺化理解卷積神經網路(反池化 pooling unpooling)
本篇博文主要講解2014年ECCV上的一篇經典文獻:《Visualizing and Understanding Convolutional Networks》,可以說是CNN領域視覺化理解的開山之作,這篇文獻告訴我們CNN的每一層到底學習到了什麼特徵,然後作者通過視覺化進行調整網路,提高了精度。最近兩年深層
深度學習caffe實戰筆記(13)利用MATLAB視覺化mnist資料集
之前的部落格中介紹過利用MATLAB視覺化影象特徵,因為最近在看《深度學習21天實戰caffe》,裡面有一章節是關於視覺化的,所以把視覺化mnist資料集的程式碼共享一下,在這裡要感謝趙永科老師 clc; clear; close all; image_fil
深度學習(二十七)視覺化理解卷積神經網路
視覺化理解卷積神經網路作者:hjimce一、相關理論本篇博文主要講解2014年ECCV上的一篇經典文獻:《Visualizing and Understanding Convolutional Netw
Android學習記錄(1)—Android中XML檔案的序列化生成與解析
xml檔案是非常常用的,在android中json和xml是非常常用的兩種封裝資料的形式,從伺服器中獲取資料也經常是這兩種形式的,所以學會生成和解析xml和json是非常有用的,json相對來說是比較簡單的,咱不做介紹了,這裡給大家講一下xml的序列化生成和解析。不廢話了,
《PCL點雲庫學習&VS2010(X64)》Part 8 PCL1.72(VTK6.2.0)視覺化例程
Part 8 PCL1.72(VTK6.2.0)視覺化例程 PCL1.72 VTK
python 學習記錄(7)-迴圈/結構化程式(氣泡排序)
1.1 while 迴圈 #!/usr/bin/python # -*- coding: UTF-8 -*- i = 1 while i <10: i = i + 1 print i # while迴圈 numbers = raw_input
Tensorflow學習筆記:基礎篇(7)——Mnist手寫集改進版(Tensorboard視覺化)
Tensorflow學習筆記:基礎篇(7)——Mnist手寫集改進版(Tensorboard視覺化介面) 前序 — 前文中,我們在三層全連線神經網路中使用了學習率隨迭代次數增加而逐漸衰減的AdamOptimizer優化器來完成MNIST資料的分類問題,最
BigData 學習記錄(三)
如果 lock 都沒有 stream 節點 信息 nod 存在 物理 master/slave主從結構: HDFS是一個 master/slave的架構。HDFS只有一個NameNode,即master。master負責管理文件系統命名空間和client對文件的訪問。此外,
BigData 學習記錄(五)
merge 而且 seq 運行時間 big 存儲位置 完成 setup 其中 MR(MapReduce)運行過程 client程序--》提交job至JobTracker--》分配job ID--》JobTracker檢查輸入文件存在,輸出文件不存在--》進行輸入分片--
JS學習記錄(補充二)
har title 求和 .com ron alert += 顯示 utf-8 循環變量<html lang="en"> <head> <meta charset="UTF-8"> <title>循環變量&l
JS學習記錄(補充三)
bre protoc 漢堡 replace 修飾 同名 關鍵字 進入 length 函數<html lang="en"> <head> <meta charset="UTF-8"> <title>函數<