
Building Extraction with YOLT2 and SpaceNet Data

Building Extraction with YOLT2 and SpaceNet Data
The first SpaceNet Challenge to identify building outlines from satellite imagery demonstrated that the field of computer vision as applied to satellite imagery remains relatively nascent. In many computer vision tasks (e.g. ImageNet), accuracies >95% are common, even expected. The winning SpaceNet Challenge score of
The majority of submissions to the SpaceNet Challenge utilized an image segmentation approach, where each pixel in an image is labeled as belonging to one of several classes (in this case: building or background). Since the goal of the SpaceNet challenge was to provide exact building outlines, this approach makes sense given that if one classified all pixels correctly all buildings would be precisely defined.
In this post we detail a different approach: object detection with the YOLT2 pipeline. Recall that YOLT outputs bounding rectangles around objects of interest. As such, this approach will never achieve perfect building footprint detection. Nevertheless, we demonstrate that this approach proves competitive for the challenge evaluation metric of assigning a true positive to any proposal with a
1. YOLT2
Recall that YOLO (upon which YOLT is based) is an object detection framework that uses a 7x7 final grid, meaning that each object is placed on one of 49 boxes. YOLO version 2 incorporates a number of improvements to the original paper such as: batch normalization, finer grained features, multi-scale training, and a denser 13x13 final grid. These enhancements improve the accuracy to state-of-the-art (see Table 3 in YOLO version 2), while maintaining a speed advantage over other options such as Faster R-CNN and SSD. Many of these improvements were independently implemented in the version of YOLT discussed in previous blogs, and the remaining improvements have been incorporated into YOLT version 2.
2. Training Data
We utilize data from the first SpaceNet challenge, obtainable from AWS. In the previous post we discussed methods for transforming the GeoJSON label files into formats more conducive for machine learning. Recall that YOLT2 requires cardinally oriented rectangles to label ground truth. In this post we utilize the NumPy arrays of building pixel coordinates to infer bounding boxes around buildings.
In most computer vision object detection paradigms, bounding boxes fully encompass objects of interest. Our goal is to achieve a Jaccard index ≥ 0.5, so the ground truth bounding boxes used for YOLT2 do not fully enclose the buildings, as illustrated in Figure 1.

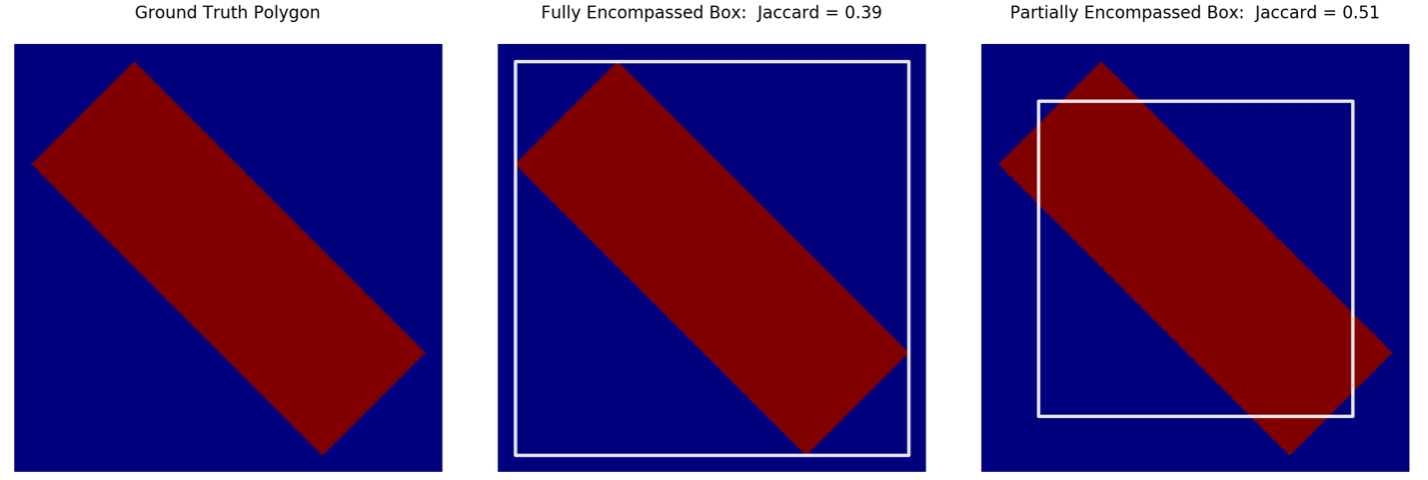
To construct training data we utilize the geojson_to_pixel_arr.py script and, as in Figure 1, construct a bounding box extending 80% of the length and width of each building in the training dataset. Examples are shown in Figure 2.


3. Model Training
We train on 90% of the SpaceNet training dataset, discarding images without any buildings present; the remaining 10% is withheld for internal testing purposes. This leaves 3926 labeled 200 x 200 meter images for training purposes. Image cutouts for the pan-sharpened 3-band imagery are 438–439 pixels in width, and 406–407 pixels in height. We craft a new network architecture with a denser 26 x 26 final grid to accurately localize buildings in the the highly concentrated regions of central Rio de Janeiro. Training occurs for for seven days on a single NVIDIA Titan X GPU.
4. Model Evaluation
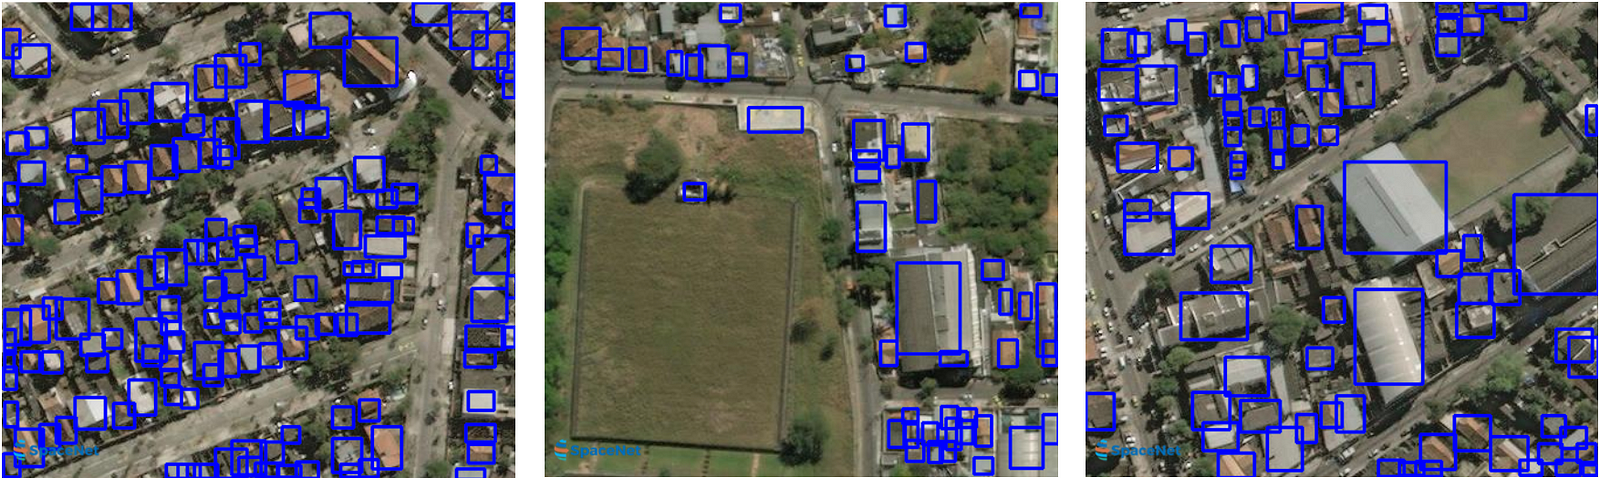
The YOLT2 SpaceNet model is evaluated on the entirety of the SpaceNet test dataset from the SpaceNet Challenge. For the 200 x 200 meter test chips the YOLT2 pipeline inference proceeds at a rate of 45 frames per second. Post-processing is minimal, simply consisting of non-max suppression. We achieve an F1 score of 0.21 over the test set; this score is certainly far from ideal, though it would have been moderately competitive in the challenge results (reported scores are F1 * 1,000,000). Example outputs are shown below.
相關推薦
Building Extraction with YOLT2 and SpaceNet Data
Building Extraction with YOLT2 and SpaceNet DataThe first SpaceNet Challenge to identify building outlines from satellite imagery demonstrated that the fie
Cola: Driving success with AI and Big Data | AITopics
With over 500 soft drink brands being sold to customers in more than 200 countries, the Coca-Cola Company is the largest beverage company in the world. Eve
Building our data science platform with Spark and Jupyter
Testing while documentingAll critical paths of the code are covered with Integration Tests using Python Doctest framework, enabling up-to-date and accurate
[Nuxt] Load Data from APIs with Nuxt and Vuex
his pro -- http template map https etc not run In a server-rendered application, if you attempt to load data before the page renders and
[HTML5] Inlining images with SVG and data URIs
mtu pan -h too tty pps ffffff row nts The main reason you want to do I"nlining images with SVG and data URIs" is to reduce http request.
problem-solving-with-algorithms-and-data-structure-usingpython(使用python解決算法和數據結構) -- 基本數據結構(一)
匹配 剛才 第一個 ems sem spl pla 查看 線性數據結構 1. 什麽是線性數據結構? 棧,隊列,deques, 列表是一類數據的容器,它們數據項之間的順序由添加或刪除的順序決定。 一旦一個數據項被添加,它相對於前後元素一直保持該位置不變。 諸
Mobile Development with C#:Building Native iOS, Android, and Windows Phone Applications
Mobile Development with C#, 該書詳細介紹使用C#開發跨平臺移動應用,基於Mono平臺,使用.Net開發語言,開發多移動平臺應用,iOS,Android,Windows Phone。 書籍下載
Building and Documenting Python REST APIs With Flask and Connexion
In Part 1 of this series, you used Flask and Connexion to create a REST API providing CRUD operations to a simple in-memory structure called PEOPLE. Tha
From Cats to Categories: Processing Geospatial Data with Machine and Deep Learning
With the exponential growth of the number of images (and radar data, and point clouds, and…) that are being collected, we must answer this question: how ar
Data Cleaning with Python and Pandas: Detecting Missing Values
Data Cleaning with Python and Pandas: Detecting Missing ValuesData cleaningcan be a tedious task.It’s the start of a new project and you’re excited to appl
Ask HN: How are you building large apps with react and GraphQL
What patterns and tools are you using to build large apps with react and GraphQL?With Apollo, do you use cache or link-state? Are you using redux (I love r
Building a Smart Air Pressure Sensor with Espruino and Angular
Building a Smart Air Pressure Sensor with Espruino and AngularHow to quickly develop custom IoT solutions using Web TechnologiesIn this post I am going to
Cleaning and Prepping Data with Python for Data Science
Check Your Data … QuicklyThe first thing you want to do when you get a new dataset, is to quickly to verify the contents with the .head() method.import pan
[PWA] Cache JSON Data in a React PWA with Workbox, and Display it while Offline
We can view the PWA offline because we are caching the static and CDN assets for the app - but the list of todo items won't display, because those API call
Building a banking voice bot with Dialogflow and KOOKOO.
Building a banking voice bot with Dialogflow and KOOKOO.Dialogflow allows you to “Build natural and rich conversational experiences”. KOOKOO provides you a
Building a Slack Bot with Go and Wit.ai @ Alex Pliutau's Blog
Building a Slack Bot with Go and Wit.ai We will build a simple Slack Bot with NLU functionality to get some useful information from Wolfr
Building a Blog with VueJS and AWS
TutorialEdge.net is a totally free programming tutorial site that has been built with the intention of helping as many people as possible learn to pro
Fetching Data, Visualizing with D3, and Deploying with Dokku
In this tutorial we’ll build a web application to grab data from the NASDAQ-100 and visualize it as a bubble graph with D3. Then to top it off, we’ll de
Pythonic Data Cleaning With NumPy and Pandas
Data scientists spend a large amount of their time cleaning datasets and getting them down to a form with which they can work. In fact, a lot of data sc
Clustering documents and gaussian data with Dirichlet Process Mixture Models
This article is the fifth part of t