
機器學習-實戰-入門-linearSVC和SVC,身高體重與胖瘦關係的分類與預測
阿新 • • 發佈:2019-01-24
作者:橘子派
宣告:版權所有,轉載請註明出處,謝謝。
實驗環境:
Windows10
Sublime
Anaconda 1.6.0
Python3.6
根據現有身高和體重訓練模型,再對測試集做出判斷
程式碼功能
一.根據現有資料建立標籤
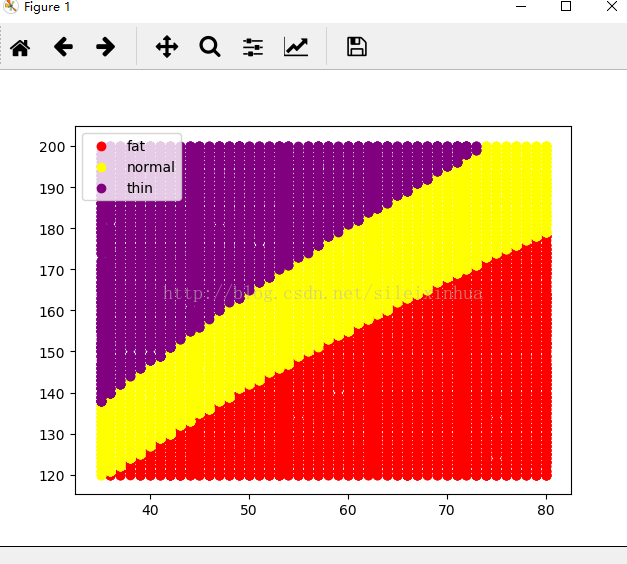
二.資料資訊視覺化繪圖
執行結果
三.運用sklearn中的SVM的SVC訓練資料並預測結果
執行結果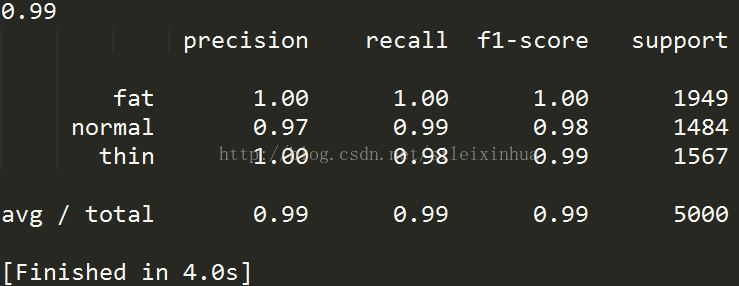
交叉驗證三組測試集平均預測精度為0.99
四.運用sklearn中的SVM的linearSVC訓練資料並預測結果
執行結果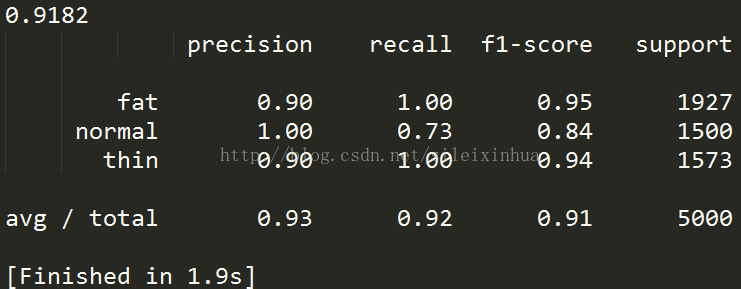
交叉驗證三組測試集平均預測精度為0.9182
參考文獻:
《統計學習方法》
《Web scraping and machine learning by python》
#對資料集進行預處理
import random

def calc_bmi(h, w):
    bmi = w / (h/100) ** 2
    if bmi < 18.5: return "thin"
    if bmi < 25.0: return "normal"
    return "fat"
#bim值小於18.5是瘦,小於25.0是普通,否側是胖

fp = open("./data/bmi.csv","w",encoding="utf-8")
fp.write("height,weight,label\r\n")

cnt = {"thin":0, "normal":0, "fat":0}
for i in range(20000):
    h = random.randint(120,200)
    w = random.randint(35, 80)
    label = calc_bmi(h, w)
    cnt[label] += 1
    fp.write("{0},{1},{2}\r\n".format(h, w, label))
fp.close()
print("ok,", cnt)
二.資料資訊視覺化繪圖
#繪製三種不同型別的資料分佈
import matplotlib.pyplot as plt
import pandas as pd

tbl = pd.read_csv("./data/bmi.csv", index_col=2)
#讀取資料

fig = plt.figure()
ax = fig.add_subplot(1, 1, 1)
#三種子圖重疊

def scatter(lbl, color):
    b = tbl.loc[lbl]
    ax.scatter(b["weight"],b["height"], c=color, label=lbl)

scatter("fat",    "red")
scatter("normal", "yellow")
scatter("thin",   "purple")
#設定不同屬性顏色

ax.legend()
plt.show()
#顯示影象
執行結果
三.運用sklearn中的SVM的SVC訓練資料並預測結果
#用sklearn的SVC方法來訓練資料集,並交叉驗證預測精度
from sklearn import cross_validation, svm, metrics
import matplotlib.pyplot as plt
import pandas as pd

tbl = pd.read_csv("./data/bmi.csv")
#讀取資料

label = tbl["label"]
#讀取資料中的標籤列
w = tbl["weight"] / 100
h = tbl["height"] / 200
wh = pd.concat([w, h], axis=1)

data_train, data_test, label_train, label_test = cross_validation.train_test_split(wh, label)
#將資料分成兩組資料集和測試集

clf = svm.SVC()
clf.fit(data_train, label_train)
#訓練資料

predict = clf.predict(data_test)
#預測資料

ac_score = metrics.accuracy_score(label_test, predict)
#生成測試精度
cl_report = metrics.classification_report(label_test, predict)
#生成交叉驗證的報告
print(ac_score)
#顯示資料精度
print(cl_report)
#顯示交叉驗證資料集報告
執行結果
#用sklearn的LinearSVC方法來訓練資料集,並交叉驗證預測精度
from sklearn import cross_validation, svm, metrics
import matplotlib.pyplot as plt
import pandas as pd

tbl = pd.read_csv("./data/bmi.csv")
#讀取資料

label = tbl["label"]
#讀取資料中的標籤列
w = tbl["weight"] / 100
h = tbl["height"] / 200
wh = pd.concat([w, h], axis=1)

data_train, data_test, label_train, label_test = cross_validation.train_test_split(wh,label)
#將資料分成兩組資料集和測試集

clf = svm.LinearSVC()
clf.fit(data_train, label_train)
#訓練資料

predict = clf.predict(data_test)
#預測資料

ac_score = metrics.accuracy_score(label_test, predict)
#生成測試精度
cl_report = metrics.classification_report(label_test, predict)
#生成交叉驗證的報告
print(ac_score)
#顯示資料精度
print(cl_report)
#顯示交叉驗證資料集報告
執行結果