利用Matplotlib和ImageMagick製作gif動畫
阿新 • • 發佈:2019-01-31
In a few previous posts, I showed
animated plots of data as it changed over time. Here's simple code to show how they can be constructed using the python libraries Matplotlib and Pandas,
and written using the external program ImageMagick. First, the libraries that I'm using:
import pandas as pd
import pymc as mc
import matplotlib.pyplot as plt
from matplotlib import animation
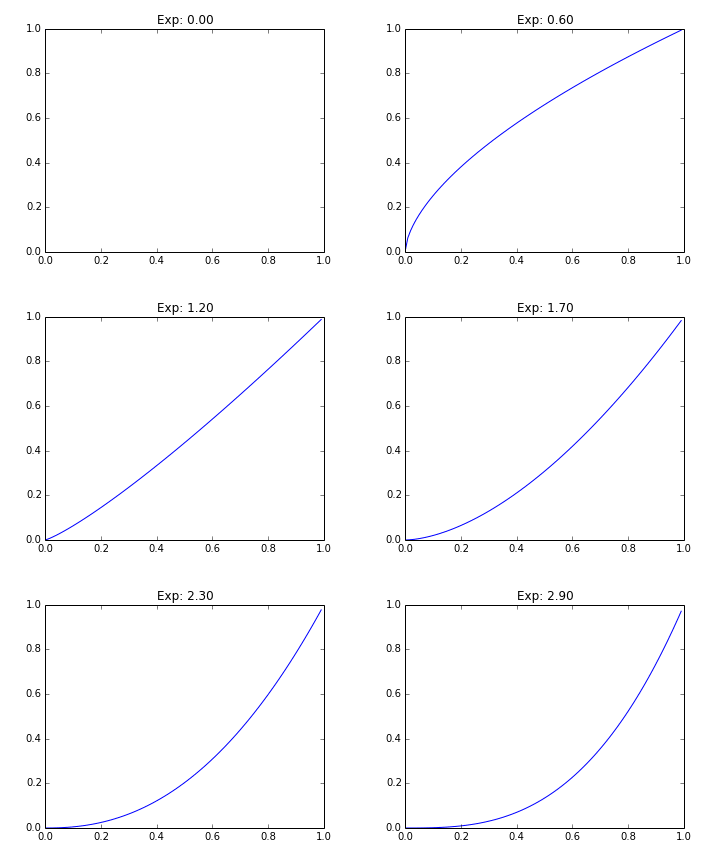
Now, lets say we want to show how the function y=x^n changes as we vary n from 0 to 3. We can generate coordinate sets for a variety of different n and save them in a pandas dataframe:
data = pd.DataFrame(data=0., index=np.arange(0, 30, 1), columns=np.arange(0,1, 0.01))
for exp in data.index.values:
data.ix[exp] = np.arange(0,1, 0.01)**(.1*exp)
We define a function that draws each graph. 'nframe' is the frame number which will be passed in by the animation control function, and is how we access the row in the dataframe that we want to plot.
def animate(nframe):
plt.cla()
plt.plot(data.columns.values, data.ix[nframe])
plt.ylim(0,1)
plt.title('Exp: %.2f'%(1.*nframe/10.))
We define a figure that we would like to draw our plot within:
fig = plt.figure(figsize=(5,4))
Matplotlib provides a control function to iterate over the frames and construct an animation object. That object has a method that allows us to save the animation as a gif, using the external program ImageMagick.
anim = animation.FuncAnimation(fig, animate, frames=30)
anim.save('demoanimation.gif', writer='imagemagick', fps=4);
 Happy Plotting!
import pandas as pd
import pymc as mc
import matplotlib.pyplot as plt
from matplotlib import animation
Now, lets say we want to show how the function y=x^n changes as we vary n from 0 to 3. We can generate coordinate sets for a variety of different n and save them in a pandas dataframe:
data = pd.DataFrame(data=0., index=np.arange(0, 30, 1), columns=np.arange(0,1, 0.01))
for exp in data.index.values:
data.ix[exp] = np.arange(0,1, 0.01)**(.1*exp)
We define a function that draws each graph. 'nframe' is the frame number which will be passed in by the animation control function, and is how we access the row in the dataframe that we want to plot.
def animate(nframe):
plt.cla()
plt.plot(data.columns.values, data.ix[nframe])
plt.ylim(0,1)
plt.title('Exp: %.2f'%(1.*nframe/10.))
We define a figure that we would like to draw our plot within:
fig = plt.figure(figsize=(5,4))
Matplotlib provides a control function to iterate over the frames and construct an animation object. That object has a method that allows us to save the animation as a gif, using the external program ImageMagick.
anim = animation.FuncAnimation(fig, animate, frames=30)
anim.save('demoanimation.gif', writer='imagemagick', fps=4);
 Happy Plotting!