MatLab繪製分段函式&啟用函式
阿新 • • 發佈:2019-02-05
1 MatLab繪製二維影象
1.1 語法
- 函式
plot(x,y,‘r’,‘lineWidth’,1)%‘r’曲線顏色,‘lineWidth’曲線寬度 - 標題
title(‘圖片描述’) - 座標軸標籤
xlabel(‘x軸’)
ylabel(‘y軸’) - 座標軸定義域
set(gca,‘XLim’,[1 100])%
set(gca,‘Ylim’,[1,100])%
##1.2 分段函式 - 分段函式
# MatLab實現
%l>-10,n<10
x=-10:1:10;
y=a.*(x<l)+b.*(x>=l&x<=m)+c.*(x>m);
plot(x,y,'r','lineWidth',1)
set(gca,'YLim',[-5 5])
title('分段函式繪製測試')
legend('曲線名稱')
grid on
2 啟用函式的MatLab實現
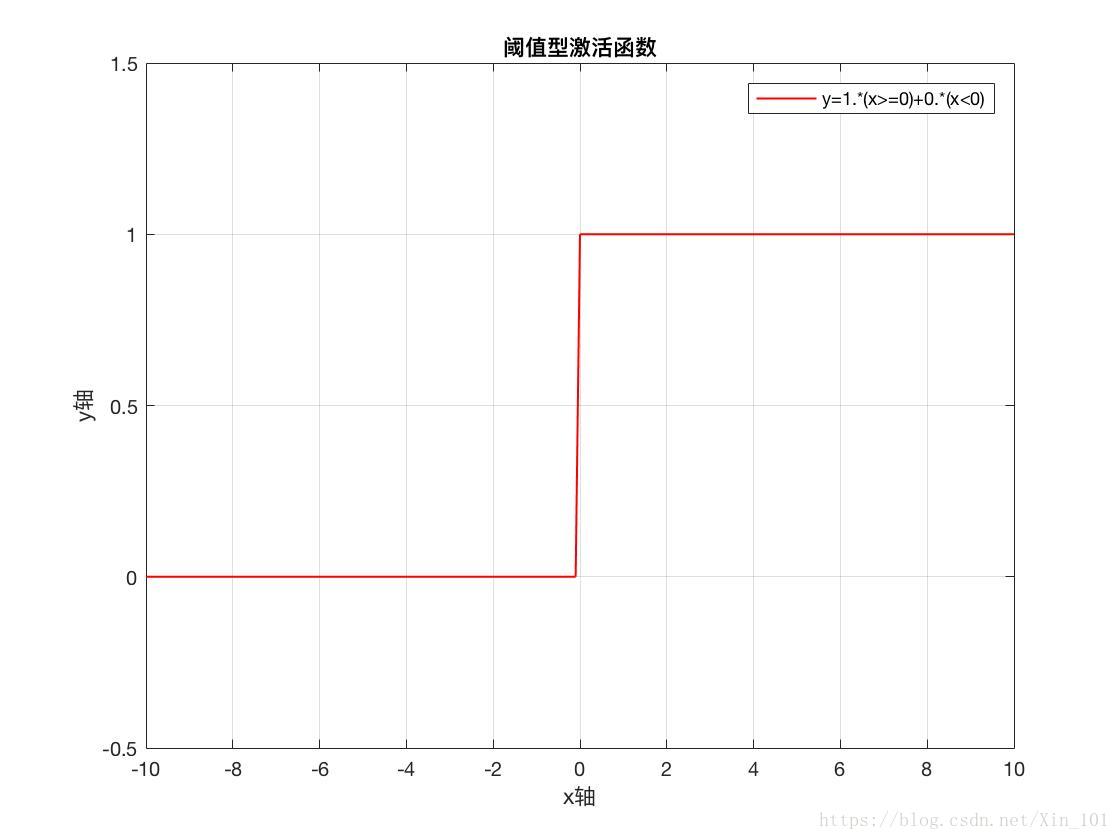
2.1 閾值型啟用函式
# MatLab程式碼
clc;clear;%清除歷史資料
figure(1)%開啟Figure1繪圖框
x = -10:0.1:10;%x定義域[-10,10],步長0.1
y=1.*(x>=0)+0.*(x<0);%分段函式
plot(x,y,'r','lineWidth',1);%開始繪圖
set(gca,'YLim',[-0.5 1.5])%設定Y軸刻度範圍
%set(gca,'YTickLabel',[-0.5:0.2:1.5])%設定Y軸顯示精度
xlabel('x軸')%x軸標籤
ylabel('y軸')%y軸標籤
title('閾值型啟用函式')%設定圖示題
legend('y=1.*(x>=0)+0.*(x<0)')%標註曲線名稱
grid on%開啟網格
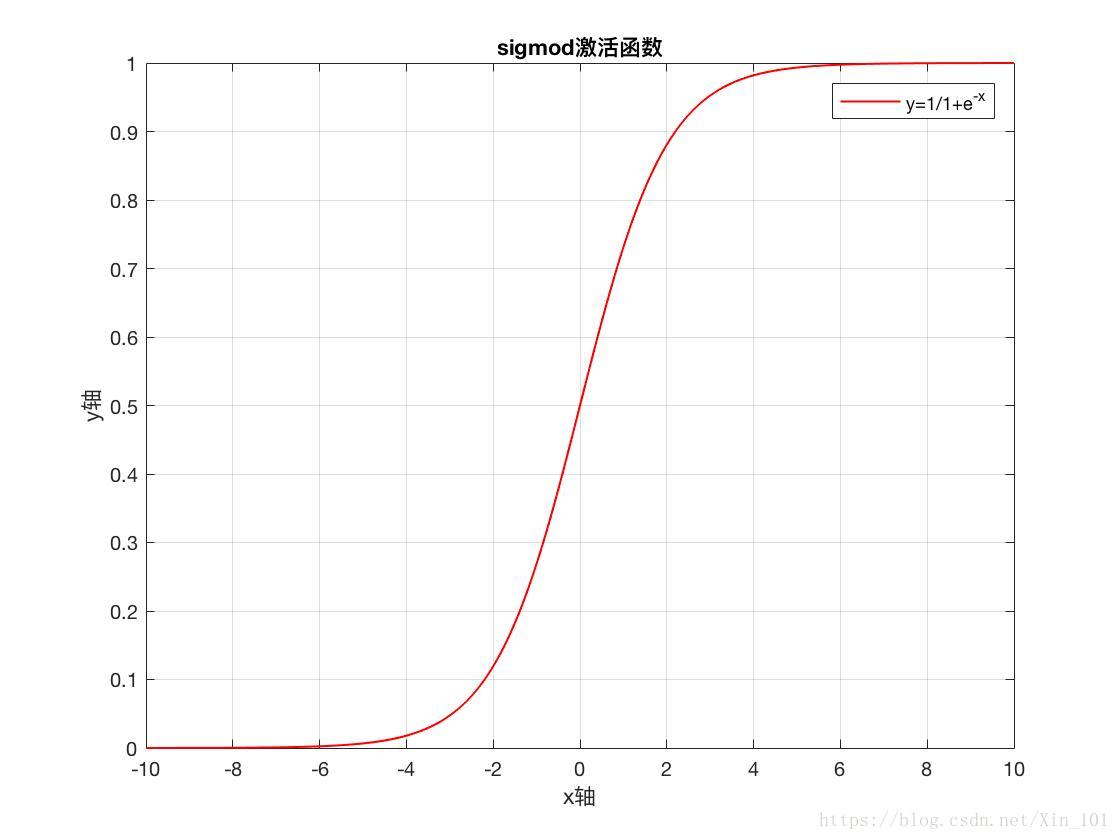
2.2 非線性啟用函式(sigmod)
# MatLab程式碼
figure(2)
x2=-10:0.1:10;
y2=1./(1+exp(-x2));
plot(x2,y2,'r','lineWidth',1);
title('sigmod啟用函式')
legend('y=1/1+e^{-x}')
xlabel('x軸')
ylabel('y軸')
grid on
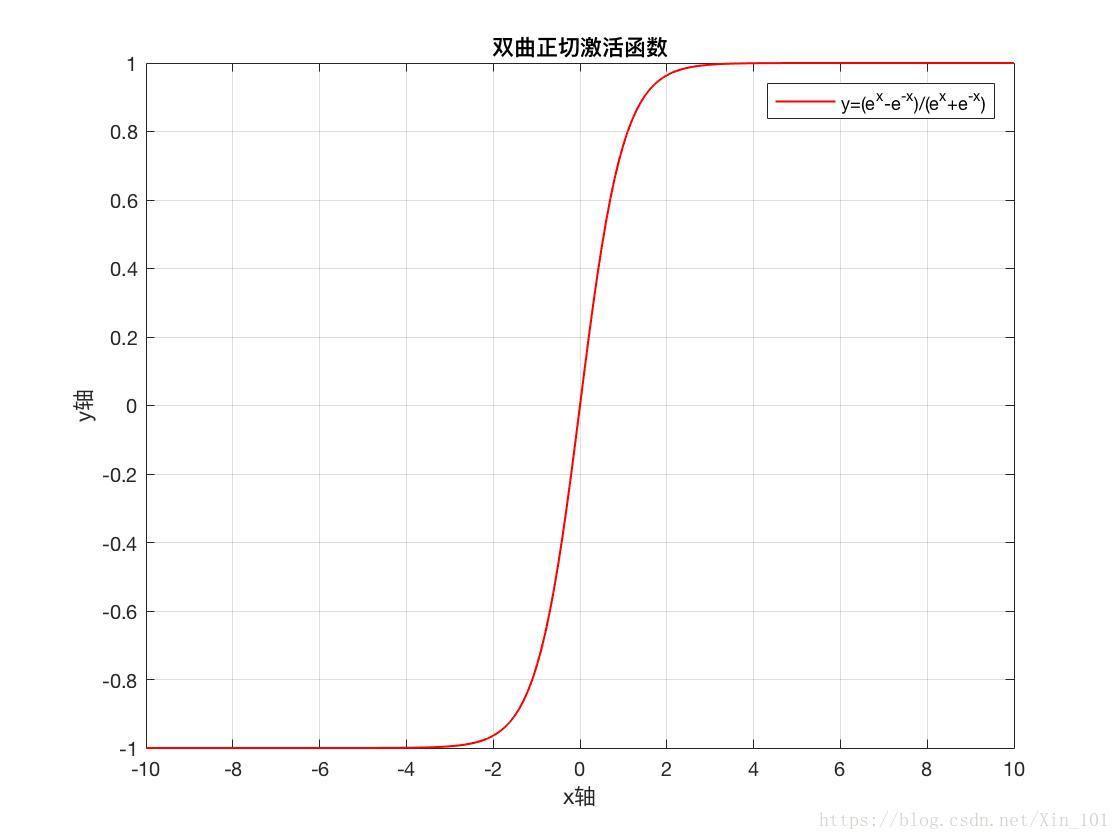
2.3 雙曲正切啟用函式
# MatLab程式碼
figure(3)
x3=-10:0.1:10;
y3=(exp(x3)-exp(-x3))./(exp(x3)+exp(-x3));
plot(x3,y3,'r','lineWidth',1)
title('雙曲正切啟用函式')
legend('y=(e^x-e^{-x})/(e^x+e^{-x})')
xlabel('x軸')
ylabel('y軸')
grid on
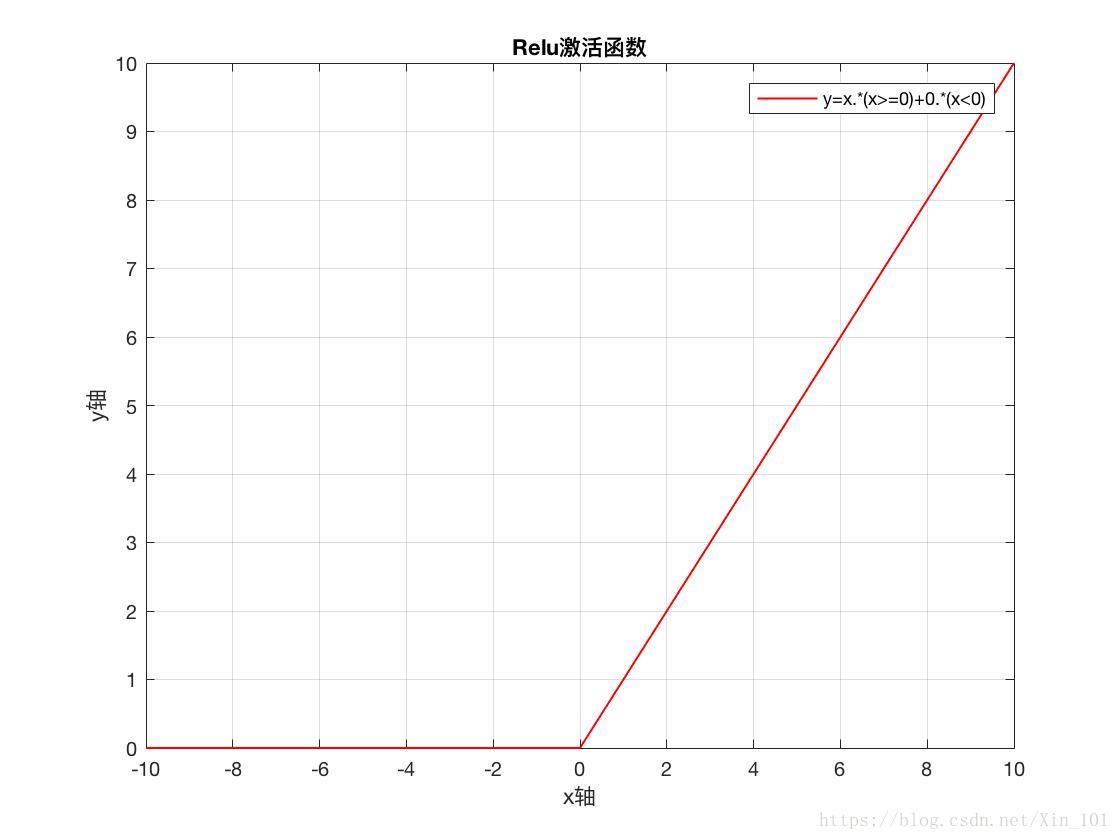
2.4 Relu(Rectified Linear Units)啟用函式
# MabLab程式碼
figure(4)
x4=-10:0.1:10;
y4=x4.*(x4>=0)+0.*(x4<0);
plot(x4,y4,'r','lineWidth',1);
title('Relu啟用函式')
legend('y=x.*(x>=0)+0.*(x<0)')
xlabel('x軸')
ylabel('y軸')
grid on