帶時間軸的折線圖echart
阿新 • • 發佈:2019-02-10
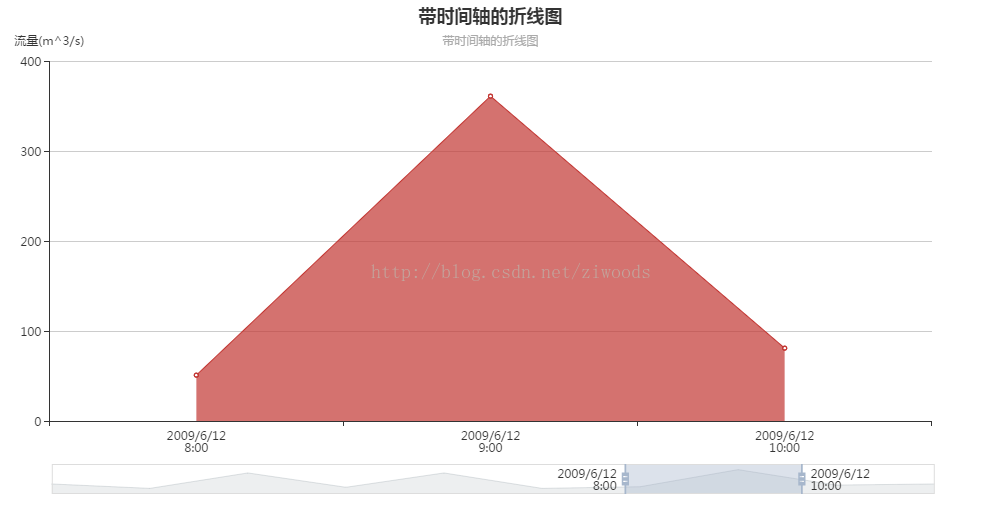
<!DOCTYPE html>
<html>
	<head>
		<meta charset="UTF-8">
		<title>帶時間軸的折線圖</title>
		<script src="//cdn.bootcss.com/echarts/3.4.0/echarts.min.js"></script>
	</head>
	<body>
		<div id="chart" style="width: 100%;height: 500px;"></div>
		<script type="text/javascript">
			// 基於準備好的dom,初始化echarts例項
			var myChart = echarts.init(document.getElementById('chart'));
			// 指定圖表的配置項和資料
			option = {
			    title : {
			        text: '帶時間軸的折線圖',
			        subtext: '帶時間軸的折線圖',
			        x: 'center',
			        align: 'right'
			    },
			    grid: {
			        bottom: 80
			    },
			    toolbox: {
			        feature: {
			            saveAsImage: {}
			        }
			    },
			    tooltip : {
			        trigger: 'axis',
			        axisPointer: {
			            animation: false
			        }
			    },
			    dataZoom: [
			        {
			            show: true,
			            realtime: true,
			            start: 65,
			            end: 85
			        },
			        {
			            type: 'inside',
			            realtime: true,
			            start: 65,
			            end: 85
			        }
			    ],
			    //x軸時間軸
			    xAxis : [
			        {
			            type : 'category',
			            data : [
			                '2009/6/12 2:00', '2009/6/12 3:00', '2009/6/12 4:00', '2009/6/12 5:00', '2009/6/12 6:00', '2009/6/12 7:00', '2009/6/12 8:00', '2009/6/12 9:00', '2009/6/12 10:00', '2009/6/12 11:00'
			            ].map(function (str) {
			                return str.replace(' ', '\n')
			            })
			        }
			    ],
			    yAxis: [
			        {
			            name: '流量(m^3/s)',
			            type: 'value'
			        }
			    ],
			    //y軸
			    series: [
			        {
			            name:'流量',
			            type:'line',
			            animation: false,
			            areaStyle: {
			                normal: {}
			            },
			            lineStyle: {
			                normal: {
			                    width: 1
			                }
			            },
			            data:[
			                100.97,20.96,300.96,40.95,300.95,20.94,50.94,360.94,80.94,100.94
			            ]
			        }
			    ]
			};
			// 使用剛指定的配置項和資料顯示圖表。
			myChart.setOption(option);
			//自適應
			window.onresize = myChart.resize;
		</script>
	</body>
</html>
效果圖: