
安卓圖表控制元件WilliamChart使用指南
阿新 • • 發佈:2019-02-12
WilliamChart是github上的一個android圖表控制元件,專案地址:https://github.com/diogobernardino/WilliamChart
該圖表控制元件效果不錯,使用也比較方便。
參考它提供的示例程式,我寫了一個更加簡單的圖表程式,步驟如下:
1.從github上下載專案,將其library專案匯入adt;
2.將其sample專案匯入adt;
3.建立自己的工程,引用library專案,並將sample專案中的DataRetriever類拷貝到本專案的原始碼目錄中;
4.建立一個chart_layout.xml程式碼如下:
<?xml version="1.0" encoding="utf-8"?>
<LinearLayout xmlns:android="http://schemas.android.com/apk/res/android"
    android:layout_width="match_parent"
    android:layout_height="match_parent"
    android:orientation="vertical" >
   <com.db.chart.view.LineChartView
		xmlns:chart="http://schemas.android.com/apk/res-auto"
		android:id="@+id/linechart"
	    android:layout_width="match_parent"
	    android:layout_height="0dp"
	    android:layout_weight=".30"
	    android:paddingTop="15dp"
	    android:paddingBottom="5dp"
	    android:paddingLeft="10dp"
	    android:paddingRight="10dp"
	    chart:chart_shadowDy="1dp"
	    chart:chart_shadowRadius="1dp"
	    chart:chart_shadowColor="#80000000"
	    chart:chart_axisColor="@color/axis"
	    chart:chart_axisBorderSpacing="0dp">
	</com.db.chart.view.LineChartView>

</LinearLayout>
5.建立一個Activity類,程式碼如下:
package com.example.wxb_example;

import com.db.chart.model.LineSet;
import com.db.chart.model.Point;
import com.db.chart.view.LineChartView;
import com.db.chart.view.YController;

import android.app.Activity;
import android.graphics.Color;
import android.os.Bundle;

public class WilliamChartActivity extends Activity {
	//線性圖表控制元件
	private static LineChartView mLineChart;
	private final static String[] mLabels = {"ANT", "GNU", "OWL", "APE", "COD","YAK", "RAM", "JAY"};

	@Override
	protected void onCreate(Bundle savedInstanceState) {
		// TODO Auto-generated method stub
		super.onCreate(savedInstanceState);
		setContentView(R.layout.chart_layout);
		mLineChart = (LineChartView) findViewById(R.id.linechart);

		LineSet data;
		mLineChart.reset();

		int nSets = 2;  //兩條線
		int nPoints = 5;  //每條線5個點
		for(int i = 0; i < nSets; i++){

			data = new LineSet();
			for(int j = 0; j < nPoints; j++)
				data.addPoint(new Point(mLabels[j], DataRetriever.randValue(0, 10)));

			data.setDots(DataRetriever.randBoolean())
				.setDotsColor(Color.parseColor(DataRetriever.getColor(DataRetriever.randNumber(0,2))))
				.setDotsRadius(DataRetriever.randDimen(4,7))
				.setLineThickness(DataRetriever.randDimen(3,8))
				.setLineColor(Color.parseColor(DataRetriever.getColor(i)))
				.setDashed(DataRetriever.randBoolean())
				.setSmooth(DataRetriever.randBoolean())
				;

			if(i == 2){
				//data.setFill(Color.parseColor("#3388c6c3"));
				int[] colors = {Color.parseColor("#3388c6c3"), Color.TRANSPARENT};
				data.setGradientFill(colors, null);
			}

			if(DataRetriever.randBoolean())
				data.setDotsStrokeThickness(DataRetriever.randDimen(1,4))
				.setDotsStrokeColor(Color.parseColor(DataRetriever.getColor(DataRetriever.randNumber(0,2))))
				;

			mLineChart.addData(data);
		}

		mLineChart.setGrid(DataRetriever.randPaint())
			.setVerticalGrid(DataRetriever.randPaint())
			.setHorizontalGrid(DataRetriever.randPaint())
			//.setThresholdLine(2, randPaint())
			.setYLabels(YController.LabelPosition.NONE)
			.setYAxis(false)
			.setXLabels(DataRetriever.getXPosition())
			.setXAxis(DataRetriever.randBoolean())
			.setMaxAxisValue(10, 2)
			.animate(DataRetriever.randAnimation(null, nPoints))
			//.show()
			;

	}

}
注意這個類中引用了拷貝過來的DataRetriever類。
執行該專案,效果如下:
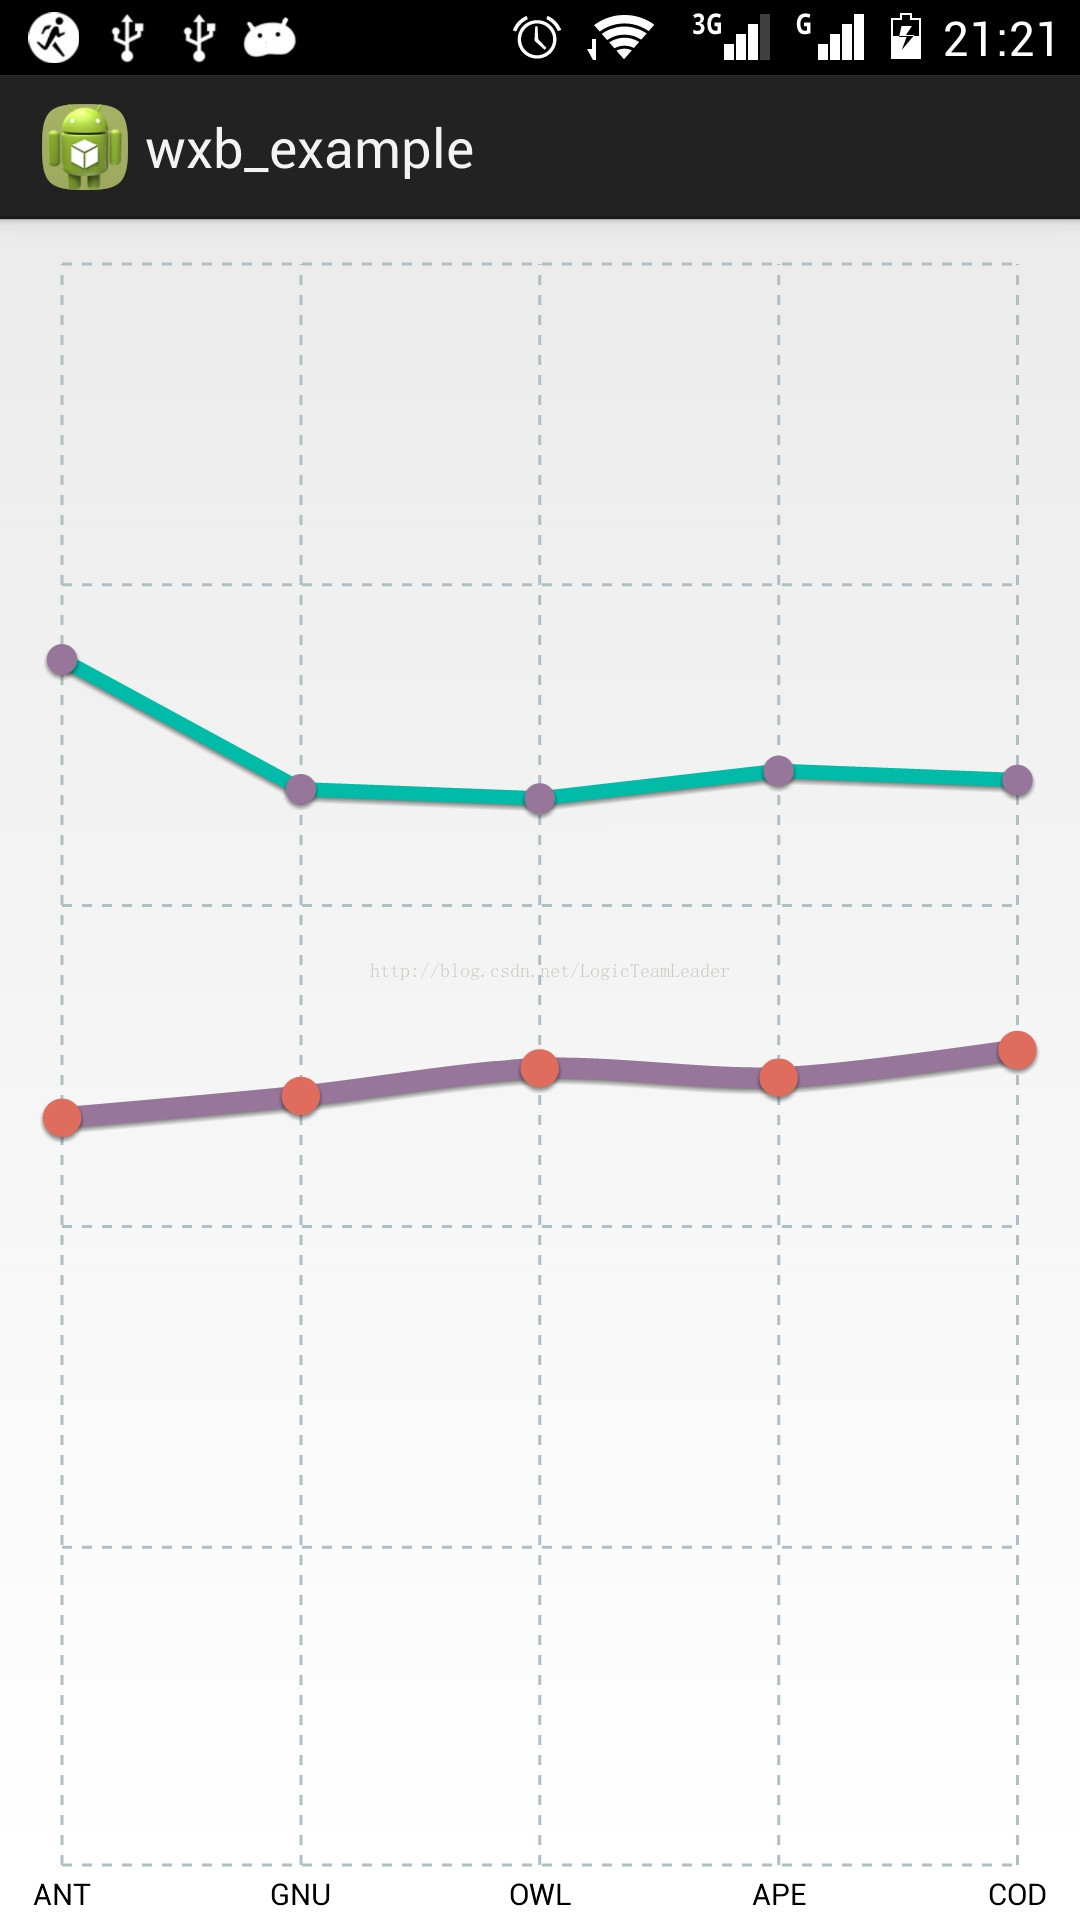
其中的效果可以自己再另行操作。