基因共表達聚類分析及視覺化
歡迎關注天下部落格:http://blog.genesino.com/2017/11/gene-cluster/
共表達基因的尋找是轉錄組分析的一個部分,樣品多可以使用WGCNA,樣品少可直接通過聚類分析如K-means、K-medoids (比K-means更穩定)或Hcluster或設定pearson correlation閾值來選擇共表達基因。
下面將實戰演示K-means、K-medoids聚類操作和常見問題:如何聚類分析,如何確定合適的cluster數目,如何繪製共表達密度圖、線圖、熱圖、網路圖等。
獲得模擬資料集
MixSim是用來評估聚類演算法效率生成模擬資料集的一個R包。
library ## a b c d e f
## Gene_1 -0.04735251 -0.7147304 0.3836436 1.322786 0.9718988 -0.5468517
## Gene_2 0.09276733 -0.8066507 0.5476909 1.351780 0.8679073 -0.6019107
## Gene_3 -0.08751894 -0.6461075 0.4371506 1.522767 0.8031865 -0.6904081
## Gene_4 0.11065988 -0.7327674 0.4550544 1.379773 0.9304277 -0.5532253 K-means
K-means稱為K-均值聚類;k-means聚類的基本思想是根據預先設定的分類數目,在樣本空間隨機選擇相應數目的點做為起始聚類中心點;然後將空間中到每個起始中心點距離最近的點作為一個集合,完成第一次聚類;獲得第一次聚類集合所有點的平均值做為新的中心點,進行第二次聚類;直到得到的聚類中心點不再變化或達到嘗試的上限,則完成了聚類過程。
聚類模擬如下圖:

聚類過程需要考慮下面3點:
1.需要確定聚出的類的數目。可通過遍歷多個不同的聚類數計算其類內平方和的變化,並繪製線圖,一般選擇類內平方和降低開始趨於平緩的聚類數作為較優聚類數, 又稱elbow演算法。下圖中拐點很明顯,5。
tested_cluster <- 12
wss <- (nrow(data)-1) * sum(apply(data, 2, var))
for (i in 2:tested_cluster) {
    wss[i] <- kmeans(data, centers=i,iter.max=100,  nstart=25)$tot.withinss
}
plot(1:tested_cluster, wss, type="b", xlab="Number of Clusters", ylab="Within groups sum of squares")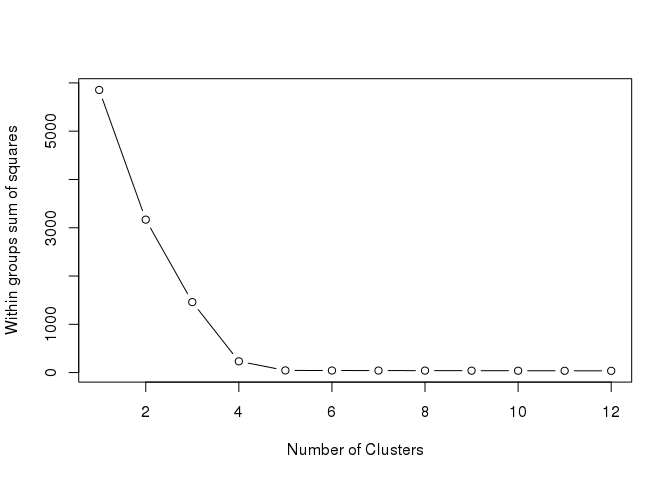
2.K-means聚類起始點為隨機選取,容易獲得區域性最優,需重複計算多次,選擇最優結果。
library(cluster)
library(fpc)
# iter.max: 最大迭代次數
# nstart: 選擇的隨機集的數目
# centers: 上一步推測出的最優類數目
center = 5
fit <- kmeans(data, centers=center, iter.max=100, nstart=25)
withinss <- fit$tot.withinss
print(paste("Get withinss for the first run", withinss))## [1] "Get withinss for the first run 44.381088289378"try_count = 10
for (i in 1:try_count) {
tmpfit <- kmeans(data, centers=center, iter.max=100, nstart=25)
tmpwithinss <- tmpfit$tot.withinss
print(paste(("The additional "), i, 'run, withinss', tmpwithinss))
if (tmpwithinss < withinss){
withins <- tmpwithinss
fit <- tmpfit
}
}## [1] "The additional 1 run, withinss 44.381088289378"
## [1] "The additional 2 run, withinss 44.381088289378"
## [1] "The additional 3 run, withinss 44.381088289378"
## [1] "The additional 4 run, withinss 44.381088289378"
## [1] "The additional 5 run, withinss 44.381088289378"
## [1] "The additional 6 run, withinss 44.381088289378"
## [1] "The additional 7 run, withinss 44.381088289378"
## [1] "The additional 8 run, withinss 44.381088289378"
## [1] "The additional 9 run, withinss 44.381088289378"
## [1] "The additional 10 run, withinss 44.381088289378"fit_cluster = fit$cluster簡單繪製下聚類效果
clusplot(data, fit_cluster, shade=T, labels=5, lines=0, color=T,
lty=4, main='K-means clusters')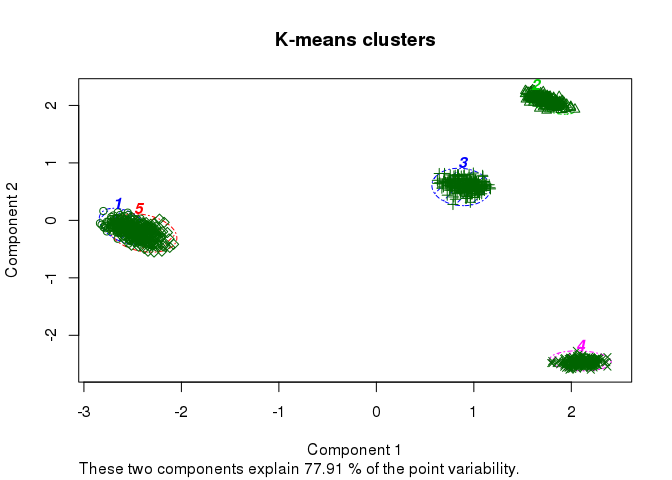
3.預處理:聚類變數值有數量級上的差異時,一般通過標準化處理消除變數的數量級差異。聚類變數之間不應該有較強的線性相關關係。(最開始模擬資料集獲取時已考慮)
K-medoids聚類
K-means演算法執行過程,首先需要隨機選擇起始聚類中心點,後續則是根據聚類結點算出平均值作為下次迭代的聚類中心點,迭代過程中計算出的中心點可能在觀察資料中,也可能不在。如果選擇的中心點是離群點 (outlier)的話,後續的計算就都被帶偏了。而K-medoids在迭代過程中選擇的中心點是類內觀察到的資料中到其它點的距離最小的點,一定在觀察點內。兩者的差別類似於平均值和中值的差別,中值更為穩健。
圍繞中心點劃分(Partitioning Around Medoids,PAM)的方法是比較常用的(cluster::pam),與K-means相比,它有幾個特徵: 1.
接受差異矩陣作為引數;2. 最小化差異度而不是歐氏距離平方和,結果更穩健;3. 引入silhouette plot評估分類結果,並可據此選擇最優的分類數目; 4. fpc::pamk函式則可以自動選擇最優分類數目,並根據資料集大小選擇使用pam還是clara (方法類似於pam,但可以處理更大的資料集) 。
fit_pam <- pamk(data, krange=2:10, critout=T)不同的分類書計算出的silhouette值如下,越趨近於1說明分出的類越好。
## 2  clusters  0.5288058
## 3  clusters  0.6915659
## 4  clusters  0.8415226
## 5  clusters  0.8661989
## 6  clusters  0.7415207
## 7  clusters  0.5862313
## 8  clusters  0.4196284
## 9  clusters  0.2518583
## 10  clusters  0.116984
獲取分類的數目
fit_pam$nc## [1] 5layout(matrix(c(1, 2), 1, 2))
plot(fit_pam$pamobject)
layout(matrix(1)) #改回每頁一張圖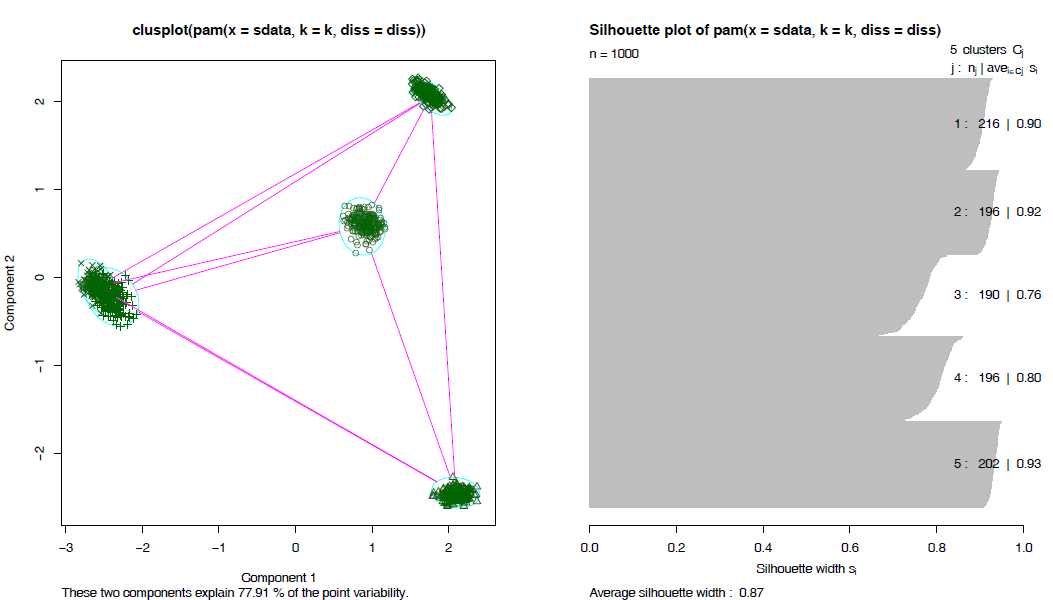
獲取分類資訊
fit_cluster <- fit_pam$pamobject$clustering資料提取和視覺化
以pam的輸出結果為例 (上面兩種方法的輸出結果都已處理為了同一格式,後面的程式碼通用)。
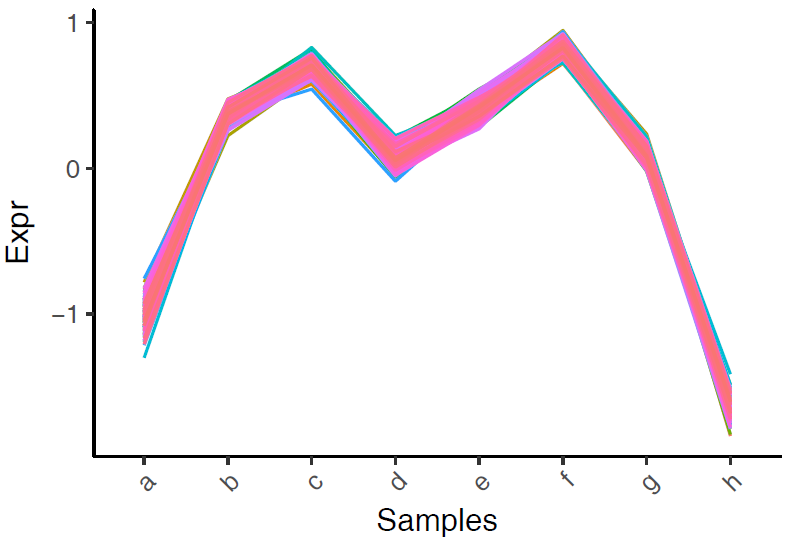
1.獲取每類數值的平均值,利用線圖一步畫圖法獲得各個類的趨勢特徵。
cluster_mean <- aggregate(data, by=list(fit_cluster), FUN=mean)
write.table(t(cluster_mean), file="ehbio.pam.cluster.mean.xls", sep='\t',col.names=F, row.names=T, quote=F)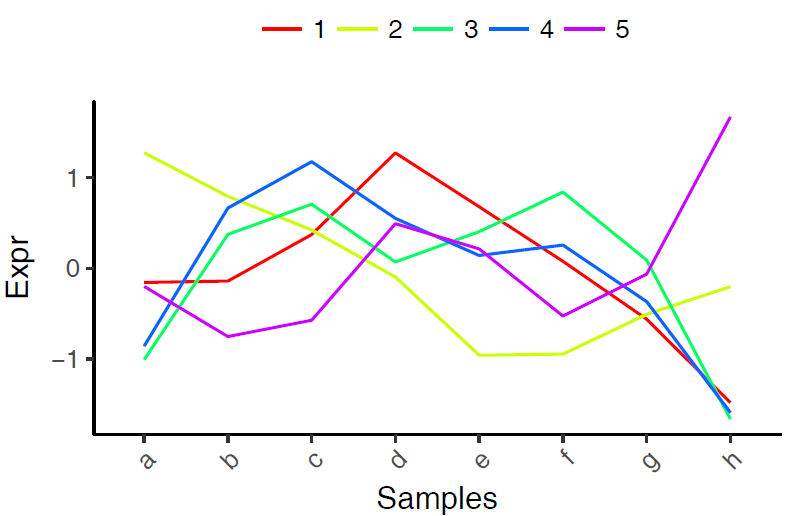
2.獲取按照分類排序的資料,繪製熱圖 (點選檢視)。
dataWithClu <- cbind(ID=rownames(data), data, fit_cluster)
dataWithClu <- as.data.frame(dataWithClu)
dataWithClu <- dataWithClu[order(dataWithClu$fit_cluster),]
write.table(dataWithClu, file="ehbio.pam.cluster.xls",
        sep="\t", row.names=F, col.names=T, quote=F)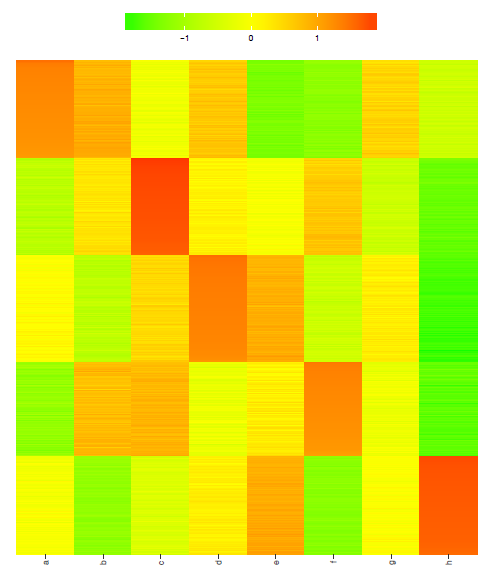
3.獲取每類資料,繪製多線圖和密度圖
cluster3 <- data[fit_cluster==3,]
head(cluster3)
## a b c d e f
## Gene_413 -1.2718728 0.6957162 0.9963399 -0.1895966 0.1786798 1.225407
## Gene_414 -1.1705230 0.6765085 0.8689340 -0.2155533 0.4176178 1.251818
## Gene_415 -0.9545339 0.5635188 0.8437158 -0.1360588 0.2084771 1.316728
## Gene_416 -1.0888687 0.8269888 0.7590209 -0.3090701 0.4478664 1.275057
## Gene_417 -1.1230295 0.8282559 0.9112640 -0.2524612 0.3966905 1.104951
## Gene_418 -1.1291253 0.9574904 0.8405449 -0.1200131 0.1964983 1.155913
## g h
## Gene_413 -0.11021165 -1.524462
## Gene_414 -0.22266636 -1.606135
## Gene_415 -0.03562464 -1.806222
## Gene_416 -0.32047268 -1.590522
## Gene_417 -0.21171923 -1.653951
## Gene_418 -0.27792177 -1.623386cluster3 <- t(cluster3)多線圖,繪製見線圖繪製。
data_rownames <- rownames(cluster3)
data_mean <- data.frame(id=data_rownames, data_mean=rowMeans(cluster3))
data_mean
## id data_mean
## a a -1.1708878
## b b 0.7811888
## c c 0.8443212
## d d -0.2008149
## e e 0.2382650
## f f 1.2601860
## g g -0.1612029
## h h -1.5910553library(reshape2)
library(ggplot2)
data_melt <- melt(cluster3)
colnames(data_melt) <- c("id", "Gene", "Expr")
ggplot(data_melt, aes(id, Expr)) + stat_density_2d(aes(alpha=..level.., group=1)) + stat_smooth(data=data_mean, mapping=aes(x=id, y=data_mean, colour="red", group=1), se=F) + theme(legend.position='none')## `geom_smooth()` using method = 'loess'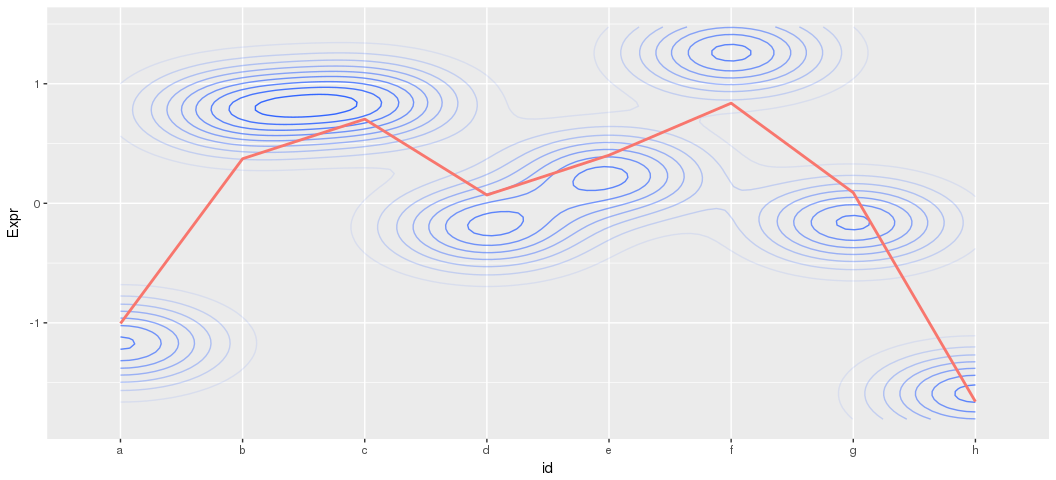
等高線的顏色越深表示對應的Y軸的點越密,對平均值的貢獻越大;顏色淺的點表示分佈均勻。不代表點的多少。等高線的變化趨勢與平均值曲線一致。
