Dot 與 GraphViz 經驗總結
阿新 • • 發佈:2019-02-16
reference
ubuntu
注:本人僅在ubuntu上進行了測試
安裝
- sudo apt-get install graphviz
在ubuntu16.04上就這樣安裝好了,從原始碼上安裝失敗,少了scan.c,反正能用,所以不管了。
使用
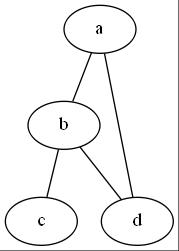
- dot -Tjpg example.dot -oexample.jpg
- example.dot
graph graphname{
a--b;
b--c;
b--d;
d--a;
}- 指明輸出格式為jpg, -Tjpg, 所有輸出格式
- 指明輸出檔名為example.jpg -oexample.jpg
- example.jpg
An Ugly Tool and A nice Plugin
- DotEditor: 編輯功能極弱,用法是用別的編輯器進行dot檔案編輯,再複製到DotEditor中進行顯示。
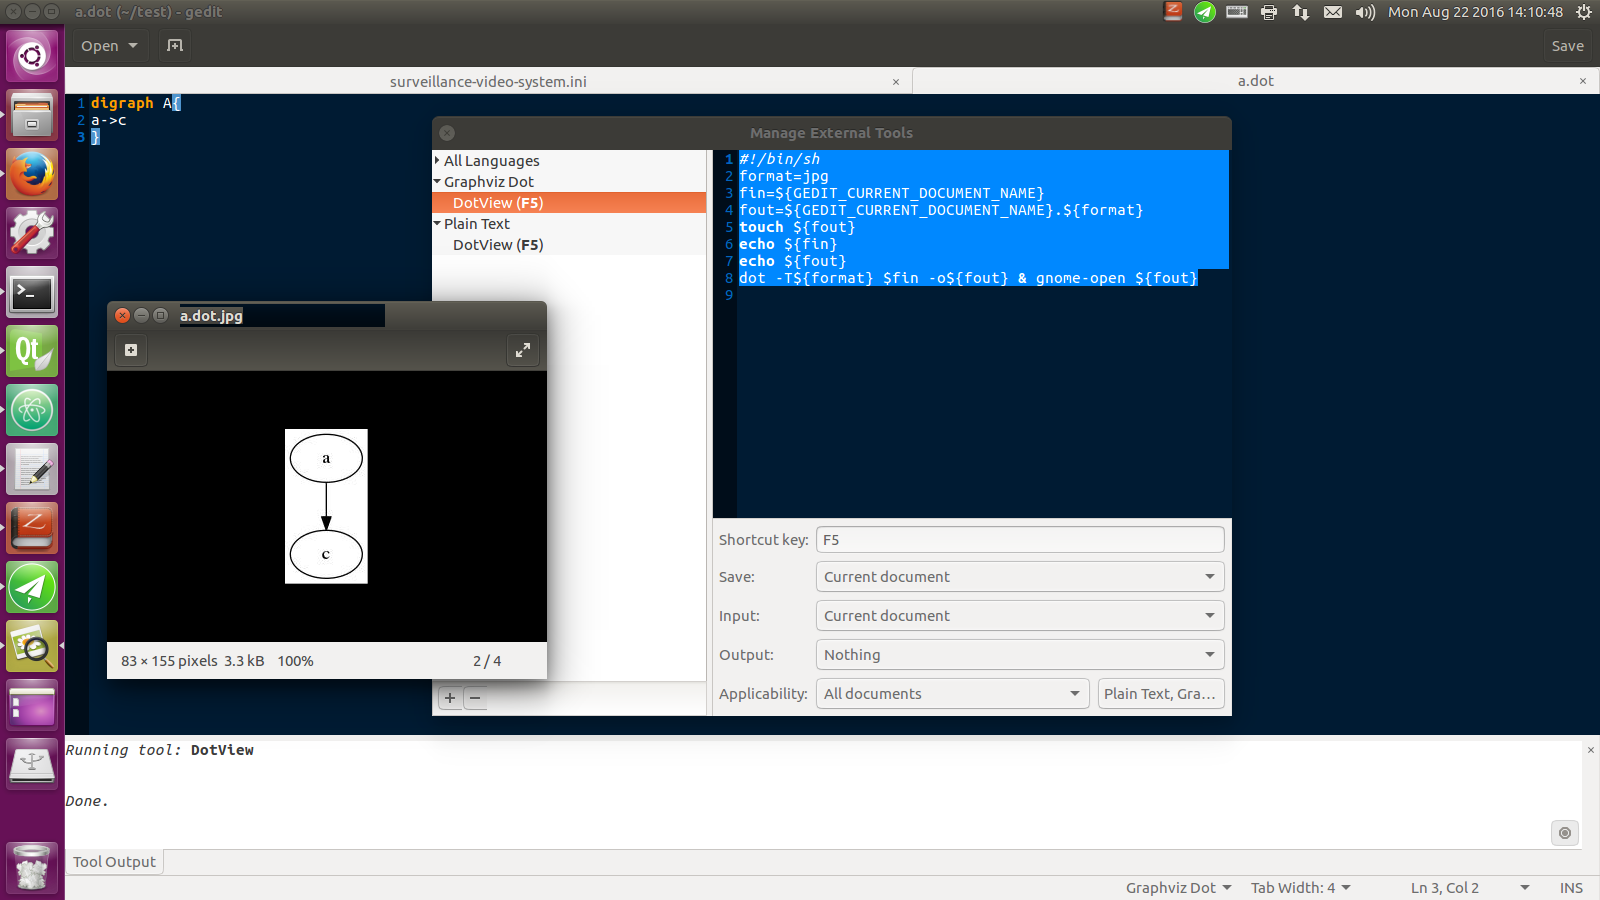
- [gedit plugin external tool]:自定義功能極強,可結合gedit 的編輯能力,非常好用。在下面的指令碼和圖示配置下,按
F5即可顯示dot影象。
#!/bin/sh
format=jpg
fin=${GEDIT_CURRENT_DOCUMENT_NAME}
fout=${GEDIT_CURRENT_DOCUMENT_NAME}.${format}
touch ${fout}
echo High Level Summary
- for subgraph, the
cluster_i(i=0,1,2,…) is special - we can use
{...}to set local environment - set node
node [style=filled,color=lightpink]; - set edge
a->b [label='...'] - use set
{a,b,c}->c; a->{b,c,d} - set edge direction
edge [dir=both/none/forward/back;penwidth=3],digraph,graph - set graph direction
rankdir="TB", "LR", "BT", "RL" - for color
node [style=filled,color=lightyellow];see color gallery
digraph G {

    subgraph Ncluster_0 {
        style=filled;
        color=lightgrey;
        node [style=filled,color=lightgray];
        start -> "motion detection" -> "connected component analysis" -> "small area filter" -> "object feature extraction" -> "object association" -> "association graph" -> "find min tree";
        class -> "IBGS.process()" -> "icvprCcaByTwoPass()" -> "QYzbxTrackingFeature.getObjectsFromMask()" -> "QYzbxTrackingFeature.getObjects()" -> "TrackingObjectAssociation.adjecentObjectAssociation()" -> "TrackingObjectAssociation.process()" -> "MotionBasedTracker.objectTracking()";
        data -> "image:CV_8UC3" -> "mask:CV_8UC1" -> "vector<mask>" -> "vector<ObjectFeature>" -> "list<FrameFeature>" ->"DirectGraph"->"tracking record";
        label="2016/08/20: Connected Component Analysis"
    }

    subgraph Ncluster_1 {
        style=filled
        color=blue
        node [style=filled,color=lightpink];
        "motion detection" -> "contour analysis" -> "kalman filter" -> "hungrian algorithm" -> "trakcking result"
        data -> "image:CV_8UC3" -> "mask:CV_8UC1" -> "contour:vector<Point>" -> "vector<trackingObjectFeature>" -> "MultiObjectTracker:vector<singleObjectTracker>"
        label="2016/08/22: findContour"
    }

    subgraph Ncluster_2 {
        style=filled
        color=red
        node [style=filled,color=lightyellow];
        "motion detection" -> "blob detection" -> "kalman filter" -> "hungrian algorithm" -> "trakcking result"
        data -> "image:CV_8UC3" -> "mask:CV_8UC1" -> "blob feature" -> "vector<trackingObjectFeature>" -> "MultiObjectTracker:vector<singleObjectTracker>"
        label="2016/08/23: blob detector"
    }

}
digraph G{
    {node[style=filled,color=lightyellow]
        input
        "QString:configFile"
        "QString:videoFile"
        "TrackingStatus*:status"
    }

    {node[style=filled,color=lightpink]
        function
        "void:process()"
        "void:processOne()"
        "vector<trackingObjectFeature>:getObjects()"
        "void:Tracking()"
        "void:run()"
        "void:stop()"
    }

    {node[style=filled,color=lightblue]
        explain
        "show tracking result"
        "init singleObjectTracker"
        "update singleObjectTracker"
    }

    {"QString:configFile","QString:videoFile"}->"void:process()"
    "void:process()"->{"Mat:img_input","Mat:img_foreground","Mat:img_background"}
    "void:process()"->"void:processOne()"->"vector<trackingObjectFeature>:getObjects()"->"vector<trackingObjectFeature>"->"void:Tracking()"
    "void:Tracking()"->"init singleObjectTracker"->"update singleObjectTracker"[label="kalman and hungrian"]
    "void:processOne()"->"show tracking result"
    "void:process()"->"void:run()"

    {"Mat:img_input","Mat:img_foreground","Mat:img_background","TrackingStatus*:status"}->"void:processOne()"

    {edge [dir=both;penwidth=3]
        "TrackingStatus*:status"->"TrackingStatus*:globalTrackingStatus"[label="always equal to"]
        {"TrackingStatus*:globalTrackingStatus","bool:globalStop"}->"void:run()"
        "void:process()"->"TrackingStatus*:status"
    }

    "void:stop()"->"bool:globalStop"
}

