使用echarts畫一個類似組織結構圖的圖表
昨天,寫了一篇關於圓環進度條的部落格(請移步:Vue/React圓環進度條),已經煩不勝煩,今天又遇到了需要展示類似公司的組織結構圖的功能需求,要冒了!!!
這種需求,自己用div+css也是可以實現的,但是沒有什麼動畫效果,我的css3又很差勁,而且專案中已經使用到了折線圖、餅狀圖、柱狀圖之類的圖表,用的還是百度的echarts,所以這個組織結構圖之類的需求也就用了百度的echarts來實現了。
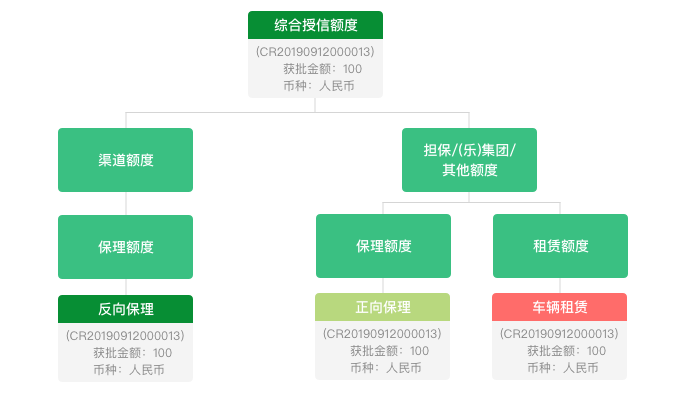
以前用echarts寫折線圖、柱狀圖、餅狀圖的較多,它的API還算比較熟悉,但是畫組織結構這樣的樹狀圖就很苦逼了,沒用過啊,而且設計給的樹狀圖的展示效果跟echarts樹狀圖的展示效果相去甚遠,我滴孩,又得一通費時費力的研究,設計圖如下:

如圖所示,一個樹節點中可能會有兩種不同的背景色,還有兩種不同的文字顏色,每個節點展示的還是圓角矩形。有同學說了,echarts有設定圓角的API啊,直接設定不就完事了。我想說的是,它是提供的有這樣的API,但是按照正常的套路實現不了啊。
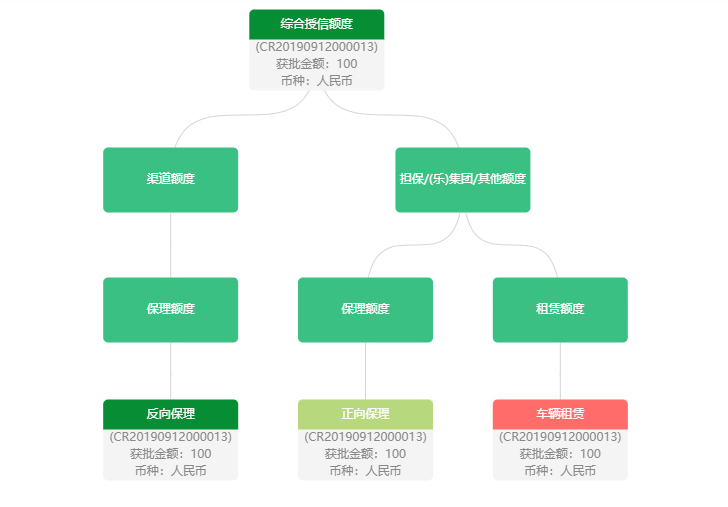
從圖上還可以看到一個幾乎實現不了的效果,就是連線每個節點之間的線的拐角處都是直角而不是平滑的,而且echarts沒有給出可以設定拐角處是直角的API,只是給了一個curveness(API的描述是樹圖邊的曲度),這玩意兒使用了之後,也還是實現不了的。
從網上查了資料,有人說可以修改echarts的原始碼,這種解決辦法我不推薦,是因為在vue或react專案中,echarts是需要通過安裝在package.json中的,如果是多人並行開發,那麼別人安裝的echarts就不是你修改後的echarts,這就是問題所在。
最後用echarts畫出來的效果還是很不錯的,唯一沒有實現的就是連線每個節點的線的拐角處不是直角,有好的解決辦法的,還望不吝賜教,謝謝!展示一下最終的成果:

說了那麼多,還是上程式碼吧,該程式碼是基於vue的,如果要使用在react中,稍微修改一下就可以了。
元件tree.vue:
<template>
  <div :class="className" :style="{height:height,width:width}" />
</template>

<script>
import echarts from "echarts";
require("echarts/theme/macarons");
import { debounce } from "@/utils";

export default {
  props: {
    className: {
      type: String,
      default: "chart"
    },
    width: {
      type: String,
      default: "100%"
    },
    height: {
      type: String,
      default: "500px"
    },
    chartData: {
      type: Object,
      required: true
    }
  },
  data() {
    return {
      chart: null,
    };
  },
  watch: {
    chartData: {
      deep: true,
      handler(val) {
        this.setOptions(val);
      }
    }
  },
  mounted() {
    this.initChart();
    //是否需要自適應-加了防抖函式
    this.__resizeHandler = debounce(() => {
      if (this.chart) {
        this.chart.resize();
      }
    }, 100);
    window.addEventListener("resize", this.__resizeHandler);

    // 監聽側邊欄的變化以實現自適應縮放
    const sidebarElm = document.getElementsByClassName("sidebar-container")[0];
    sidebarElm.addEventListener("transitionend", this.sidebarResizeHandler);
  },
  beforeDestroy() {
    if (!this.chart) {
      return;
    }
    window.removeEventListener("resize", this.__resizeHandler);
    this.chart.dispose();
    this.chart = null;

    const sidebarElm = document.getElementsByClassName("sidebar-container")[0];
    sidebarElm.removeEventListener("transitionend", this.sidebarResizeHandler);
  },
  methods: {
    initChart() {
      this.chart = echarts.init(this.$el, "macarons");
      this.setOptions(this.chartData);
    },
    setOptions(data) {
      this.chart.setOption({
        //提供資料檢視、還原、下載的工具
        // toolbox: {
        //   show : true,
        //   feature : {
        //     mark : {show: true},
        //     dataView : {show: true, readOnly: false},
        //     restore : {show: true},
        //     saveAsImage : {show: true}
        //   }
        // },
        series: [
          {
            name: "統一授信檢視",
            type: "tree",
            orient: "TB", //豎向或水平   TB代表豎向  LR代表水平
            top: '10%',
            initialTreeDepth: 10,  //樹圖初始展開的層級(深度)
            expandAndCollapse: false,   //點選節點時不收起子節點,default: true
            symbolSize: [135, 65],
            itemStyle: {
              color: 'transparent',
              borderWidth: 0,
            },
            lineStyle: {
              color: '#D5D5D5',
              width: 1,
              curveness: 1,
            },
            data: [data]
          }
        ]
      });
    },
    sidebarResizeHandler(e) {
      if (e.propertyName === "width") {
        this.__resizeHandler();
      }
    }
  }
};
</script>
使用tree.vue的方法:
<template>
    <tree :chartData="treeData" />
</template>

<script>
import tree from './tree';

export default {
  data() {
    return {
      treeData: {
        label: {
          backgroundColor: '#F4F4F4',
          borderRadius: [0, 0, 5, 5],
          formatter: [
            '{first|綜合授信額度}',
            '{second|(CR20190912000013)\n獲批金額:100\n幣種:人民幣}',
          ].join('\n'),
          rich: {
            first: {
              backgroundColor: '#078E34',
              color: '#fff',
              align: 'center',
              width: 135,
              height: 30,
              borderRadius: [5, 5, 0, 0],
            },
            second: {
              color: '#888',
              align: 'center',
              lineHeight: 17,
            },
          }
        },
        children: [
          {
            label: {
              formatter: [
                '{first|渠道額度}',
              ].join('\n'),
              rich: {
                first: {
                  backgroundColor: '#3AC082',
                  color: '#fff',
                  align: 'center',
                  width: 135,
                  height: 65,
                  borderRadius: 5,
                },
              }
            },
            children: [{
              label: {
                formatter: [
                  '{first|保理額度}',
                ].join('\n'),
                rich: {
                  first: {
                    backgroundColor: '#3AC082',
                    color: '#fff',
                    align: 'center',
                    width: 135,
                    height: 65,
                    borderRadius: 5,
                  },
                }
              },
              children: [{
                label: {
                  backgroundColor: '#F4F4F4',
                  borderRadius: [0, 0, 5, 5],
                  formatter: [
                    '{first|反向保理}',
                    '{second|(CR20190912000013)\n獲批金額:100\n幣種:人民幣}',
                  ].join('\n'),
                  rich: {
                    first: {
                      backgroundColor: '#078E34',
                      color: '#fff',
                      align: 'center',
                      width: 135,
                      height: 30,
                      borderRadius: [5, 5, 0, 0],
                    },
                    second: {
                      color: '#888',
                      align: 'center',
                      lineHeight: 17,
                    },
                  }
                },
              }]
            }]
          },
          {
            label: {
              formatter: [
                '{first|擔保/(樂)集團/其他額度}',
              ].join('\n'),
              rich: {
                first: {
                  backgroundColor: '#3AC082',
                  color: '#fff',
                  align: 'center',
                  width: 135,
                  height: 65,
                  borderRadius: 5,
                },
              }
            },
            children: [{
              label: {
                formatter: [
                  '{first|保理額度}',
                ].join('\n'),
                rich: {
                  first: {
                    backgroundColor: '#3AC082',
                    color: '#fff',
                    align: 'center',
                    width: 135,
                    height: 65,
                    borderRadius: 5,
                  },
                }
              },
              children: [{
                label: {
                  backgroundColor: '#F4F4F4',
                  borderRadius: [0, 0, 5, 5],
                  formatter: [
                    '{first|正向保理}',
                    '{second|(CR20190912000013)\n獲批金額:100\n幣種:人民幣}',
                  ].join('\n'),
                  rich: {
                    first: {
                      backgroundColor: '#B8D87E',
                      color: '#fff',
                      align: 'center',
                      width: 135,
                      height: 30,
                      borderRadius: [5, 5, 0, 0],
                    },
                    second: {
                      color: '#888',
                      align: 'center',
                      lineHeight: 17,
                    },
                  }
                },
              }]
            },
            {
              label: {
                formatter: [
                  '{first|租賃額度}',
                ].join('\n'),
                rich: {
                  first: {
                    backgroundColor: '#3AC082',
                    color: '#fff',
                    align: 'center',
                    width: 135,
                    height: 65,
                    borderRadius: 5,
                  },
                }
              },
              children: [
                {
                  label: {
                    backgroundColor: '#F4F4F4',
                    borderRadius: [0, 0, 5, 5],
                    formatter: [
                      '{first|車輛租賃}',
                      '{second|(CR20190912000013)\n獲批金額:100\n幣種:人民幣}',
                    ].join('\n'),
                    rich: {
                      first: {
                        backgroundColor: '#FF6C6A',
                        color: '#fff',
                        align: 'center',
                        width: 135,
                        height: 30,
                        borderRadius: [5, 5, 0, 0],
                      },
                      second: {
                        color: '#888',
                        align: 'center',
                        lineHeight: 17,
                      },
                    }
                  },
                },
              ]
            }]
          }
        ]
      }
    }
  },
  components: {
    tree,
  }
};
</script>
看著程式碼不多,但是實現起來,各種查echarts的API和網上的資料,而且,由於效果圖中一個節點處的文字可能會換行,文字的顏色也不同,同時有些節點處的背景色還會有兩種,以及每個節點處顯示的樣式和文字都是不固定的,所以我們可能還要面臨著將介面返回的資料再改造處理成我們想要的資料的繁瑣問題,就如同傳遞給樹節點的treeData的格式一樣,相當麻煩,如果每個節點的樣式都是一樣的,那就好辦多了,如官網的一個樹狀圖的例子:https://www.echartsjs.com/examples/zh/editor.html?c=tree-verti
