一維擴散方程的學習——來自流沙公眾號
阿新 • • 發佈:2018-11-16
來自流沙公眾號
認識:
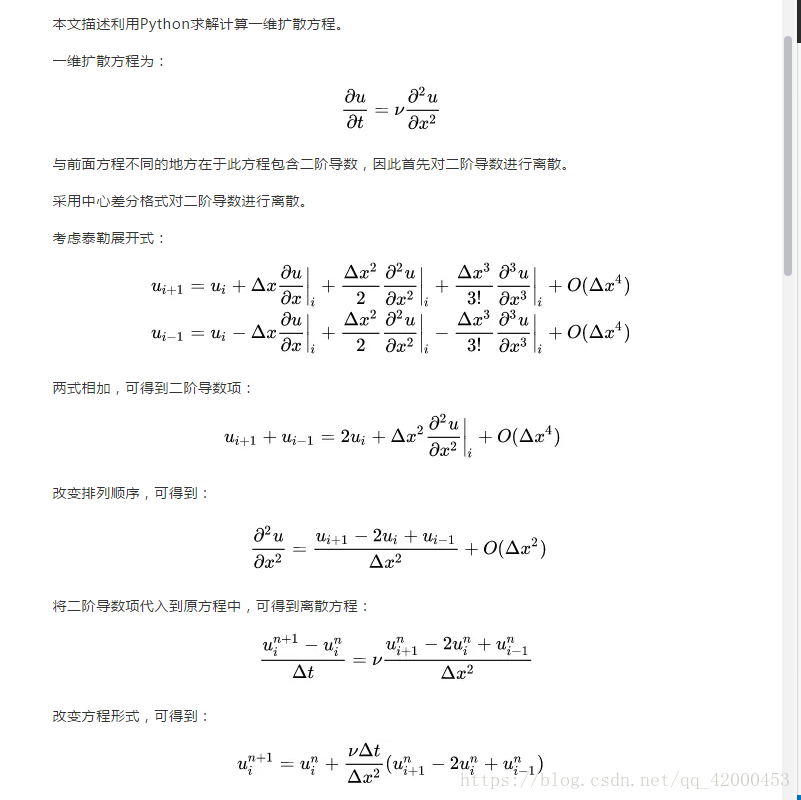
1、理論:差分離散,較為基礎
2、第一次接觸matplotlib中ion()和ioff()。ion()開啟了互動模式,ioff() 感覺像暫停影象
同時,查閱其他部落格得到:
python視覺化庫matplotlib有兩種顯示模式:
阻塞(block)模式
互動(interactive)模式
在Python Consol命令列中,預設是互動模式。而在python指令碼中,matplotlib預設是阻塞模式。
3、第一次接觸pause(time)
4、%.4f s"% (n*dt) 的用法
5、動態列印,每次列印完用cla().
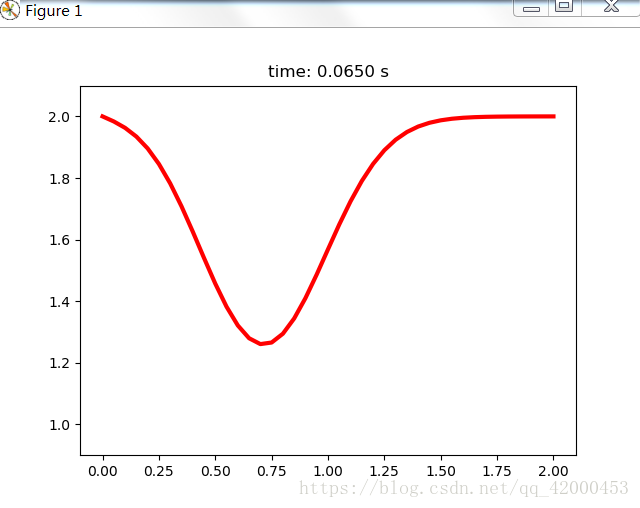
import numpy as np
import matplotlib.pyplot as plt

nx = 41 # 網格節點數
dx = 2 / (nx - 1)  # 網格尺寸
nt = 40 # 時間步長
nu = 0.3 # 擴散係數
sigma = 0.2 # 定義中間變數,用於確定時間步長dt
dt = dx**2 * sigma / nu

# 初始條件
u = 2 * np.ones(nx)
u[int(0.5/dx):int(1/dx)] = 1
un = np.ones(nx)
plt.ion() # 開啟了互動模式,開啟互動模式 ,同時開啟兩個視窗顯示圖片
plt.show()
for n in range(nt):
	plt.cla()   # 清空
	un = u.copy()
	for i in range(1,nx-1):
		u[i] = un[i] + dt * nu / dx**2 * (un[i+1] - 2 * un[i] + u[i-1])
		#繪製圖形
	plt.plot(np.linspace(0,2,nx),u,'r',linewidth=3)
	plt.ylim(0.9,2.1)    # 確定y上下軸
	plt.title("time: %.4f s"% (n*dt)) # 將時間列印到圖形
	plt.pause(0.2)  # 控制圖形顯示時間
plt.ioff()      #沒有使用ioff()關閉的話,則影象會一閃而過,並不會常留。要想防止這種情況,需要在plt.show()之前加上ioff()命令。
plt.show()
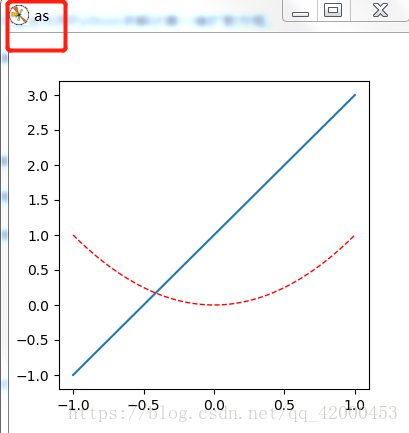
其中查詢資料的過程遇到figure,故簡單記錄一下figure用法
plt.figure(num = “as”, figsize = (4, 4)) # num 若是數字則figure 數字;若是字母則為名字
import numpy as np
import matplotlib.pyplot as plt
x = np.linspace(-1, 1, 50)
y1 = 2 * x + 1
y2 = x**2
plt.figure(num = "as", figsize = (4, 4))   # num 若是數字則figure 數字;若是字母則為名字
plt.plot(x, y1)
plt.plot(x, y2, color = 'red', linewidth = 1.0, linestyle = '--')
plt.show()
本文純粹是記錄學習過程所用。