[work] tensorboard視覺化
本章主要說明如何使用TensorBoard進行視覺化,以及部分的調參方法。
這是一篇dandelionmane在TensorFlow Dev Summit 2017關於TensorBoard介紹的總結教程。
在之前的章節中,幾乎所有的效能評估都是通過列印中間結果字串來完成的。使用更多的視覺化的圖表可以讓人對模型有一個更加直觀的認識。在本章中,我們將使用TensorBoard對模型進行視覺化。
計算圖視覺化
要視覺化TensorFlow的計算圖,需要先構建網路。
網路層
本章的網路,依然使用之前幾個章節對MNIST資料集使用的網路結構。為了方便實現,固定了其中的一部分引數。相關層如下:
# 簡單卷積層,為方便本章教程敘述,固定部分引數
def conv_layer(input,
               channels_in,    # 輸入通道數
               channels_out):  # 輸出通道數

    weights = tf.Variable(tf.truncated_normal([5, 5, channels_in, channels_out], stddev=0.05))
    biases = tf.Variable(tf.constant(0.05, shape=[channels_out]))
    conv = tf.nn.conv2d(input, filter=weights, strides=[1, 1, 1, 1], padding='SAME')
    act = tf.nn.relu(conv + biases)
    return act

# 簡化全連線層
def fc_layer(input, num_inputs, num_outputs, use_relu=True):
    weights = tf.Variable(tf.truncated_normal([num_inputs, num_outputs], stddev=0.05))
    biases = tf.Variable(tf.constant(0.05, shape=[num_outputs]))
    act = tf.matmul(input, weights) + biases

    if use_relu:
        act = tf.nn.relu(act)
    return act

# max pooling 層
def max_pool(input):
    return tf.nn.max_pool(input, ksize=[1, 2, 2, 1], strides=[1, 2, 2, 1], padding='SAME')
載入資料,構建網路
from tensorflow.examples.tutorials.mnist import input_data
data = input_data.read_data_sets('data/MNIST', one_hot=True)

x = tf.placeholder(tf.float32, shape=[None, 784])   # 固定這部分值
y = tf.placeholder(tf.float32, shape=[None, 10])
x_image = tf.reshape(x, [-1, 28, 28, 1])

conv1 = conv_layer(x_image, 1, 32)   # 增加了卷積核數目
pool1 = max_pool(conv1)

conv2 = conv_layer(pool1, 32, 64)
pool2 = max_pool(conv2)

flat_shape = pool2.get_shape()[1:4].num_elements()
flattened = tf.reshape(pool2, [-1, flat_shape])

fc1 = fc_layer(flattened, flat_shape, 1024)     # 增大神經元數目
logits = fc_layer(fc1, 1024, 10, use_relu=False)
交叉熵,優化器,準確率
# 計算交叉熵
cross_entropy = tf.reduce_mean(tf.nn.softmax_cross_entropy_with_logits(labels=y, logits=logits))

# 使用Adam優化器來訓練
optimizer = tf.train.AdamOptimizer(learning_rate=1e-4).minimize(cross_entropy)

# 計算準確率
correct_prediction = tf.equal(tf.argmax(y, axis=1), tf.argmax(logits, axis=1))
accuracy = tf.reduce_mean(tf.cast(correct_prediction, tf.float32))
建立session,訓練
session = tf.Session()
session.run(tf.global_variables_initializer())

train_batch_size = 100

for i in range(2001):
    x_batch, y_batch = data.train.next_batch(train_batch_size)

    feed_dict = {x: x_batch, y: y_batch}

    if i % 500 == 0:
        train_accuracy = session.run(accuracy, feed_dict=feed_dict)
        print("迭代輪次: {0:>6}, 訓練準確率: {1:>6.4%}".format(i, train_accuracy))

    session.run(optimizer, feed_dict=feed_dict)
迭代輪次:      0, 訓練準確率: 9.0000%
迭代輪次:    500, 訓練準確率: 93.0000%
迭代輪次:   1000, 訓練準確率: 97.0000%
迭代輪次:   1500, 訓練準確率: 98.0000%
迭代輪次:   2000, 訓練準確率: 100.0000%
可見訓練效果比較理想。
視覺化計算圖
現在需要將計算圖視覺化,需要使用tf.summary.FileWriter來將計算圖寫入指定目錄:
tensorboard_dir = 'tensorboard/mnist'   # 儲存目錄
if not os.path.exists(tensorboard_dir):
    os.makedirs(tensorboard_dir)

writer = tf.summary.FileWriter(tensorboard_dir)
writer.add_graph(session.graph)
以上程式碼執行結束後,在儲存目錄下生成了相應檔案。在終端執行如下命令:
$ tensorboard --logdir tensorboard/mnist
瀏覽器中訪問localhost:6006便可進入TensorBoard控制檯。

當前導航欄除了GRAPHS以外,其他均沒有資料,點選進入GRAPHS,可檢視如下計算圖:

然而,目前來看,這個圖實在過於複雜,因為它顯示了所有的計算細節。我們需要對程式碼進行相應的調整。
命名範圍
我們在之前的章節已經使用了為某個網路模組命名的方法。TensorFlow使用name scope來確定模組的作用範圍。對程式碼進行相應的調整,新增部分名稱和作用域:
# 簡單卷積層,為方便本章教程敘述,固定部分引數
def conv_layer(input,
               channels_in,    # 輸入通道數
               channels_out,   # 輸出通道數
               name='conv'):   # 名稱
    with tf.name_scope(name):    # 在該名稱作用域下的子變數
        weights = tf.Variable(tf.truncated_normal([5, 5, channels_in, channels_out],
                                                  stddev=0.05), name='W')
        biases = tf.Variable(tf.constant(0.05, shape=[channels_out]), name='B')
        conv = tf.nn.conv2d(input, filter=weights, strides=[1, 1, 1, 1], padding='SAME')
        act = tf.nn.relu(conv + biases)
        return act

# 簡化全連線層
def fc_layer(input, num_inputs, num_outputs, use_relu=True, name='fc'):
    with tf.name_scope(name):   # 在該名稱作用域下的子變數
        weights = tf.Variable(tf.truncated_normal([num_inputs, num_outputs],
                                                  stddev=0.05), name='W')
        biases = tf.Variable(tf.constant(0.05, shape=[num_outputs]), name='B')
        act = tf.matmul(input, weights) + biases

        if use_relu:
            act = tf.nn.relu(act)
        return act

# max pooling 層
def max_pool(input):
    return tf.nn.max_pool(input, ksize=[1, 2, 2, 1], strides=[1, 2, 2, 1], padding='SAME')
給其他的部分同樣新增名稱和相關作用域:
x = tf.placeholder(tf.float32, shape=[None, 784], name='x')
y = tf.placeholder(tf.float32, shape=[None, 10], name='labels')
x_image = tf.reshape(x, [-1, 28, 28, 1])

conv1 = conv_layer(x_image, 1, 32, 'conv1')
pool1 = max_pool(conv1)

conv2 = conv_layer(pool1, 32, 64, 'conv2')
pool2 = max_pool(conv2)

flat_shape = pool2.get_shape()[1:4].num_elements()
flattened = tf.reshape(pool2, [-1, flat_shape])

fc1 = fc_layer(flattened, flat_shape, 1024, name='fc1')
logits = fc_layer(fc1, 1024, 10, use_relu=False, name='fc2')

# 計算交叉熵
with tf.name_scope("xent"):
    cross_entropy = tf.reduce_mean(tf.nn.softmax_cross_entropy_with_logits(labels=y, logits=logits))

# 使用Adam優化器來訓練
with tf.name_scope('optimizer'):
    optimizer = tf.train.AdamOptimizer(learning_rate=1e-4).minimize(cross_entropy)

# 計算準確率
with tf.name_scope('accuracy'):
    correct_prediction = tf.equal(tf.argmax(y, axis=1), tf.argmax(logits, axis=1))
    accuracy = tf.reduce_mean(tf.cast(correct_prediction, tf.float32))
先不訓練,建立一個新的目錄儲存新的計算圖,然後將計算圖寫入這個目錄
tensorboard_dir = 'tensorboard/mnist2'   # 儲存目錄
if not os.path.exists(tensorboard_dir):
    os.makedirs(tensorboard_dir)

writer = tf.summary.FileWriter(tensorboard_dir)
writer.add_graph(session.graph)
執行tensorboard,將logdir指向新的目錄,計算圖如下:

現在的計算圖變得更加直觀容易理解,因為它將部分的細節藏在了一個個大的模組裡面。點選某個模組可以檢視它的內部細節:
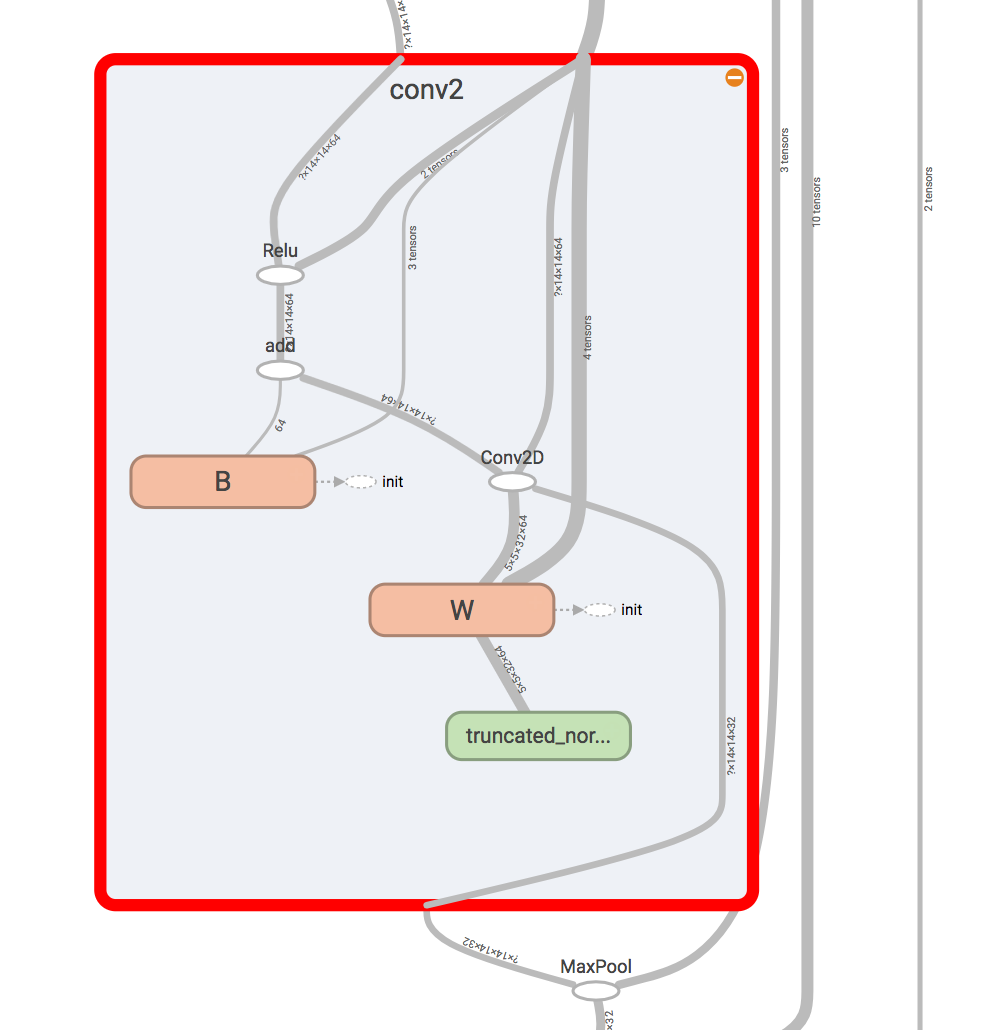
可以看到,定義的名稱W和B是屬於conv2內部的子名稱。
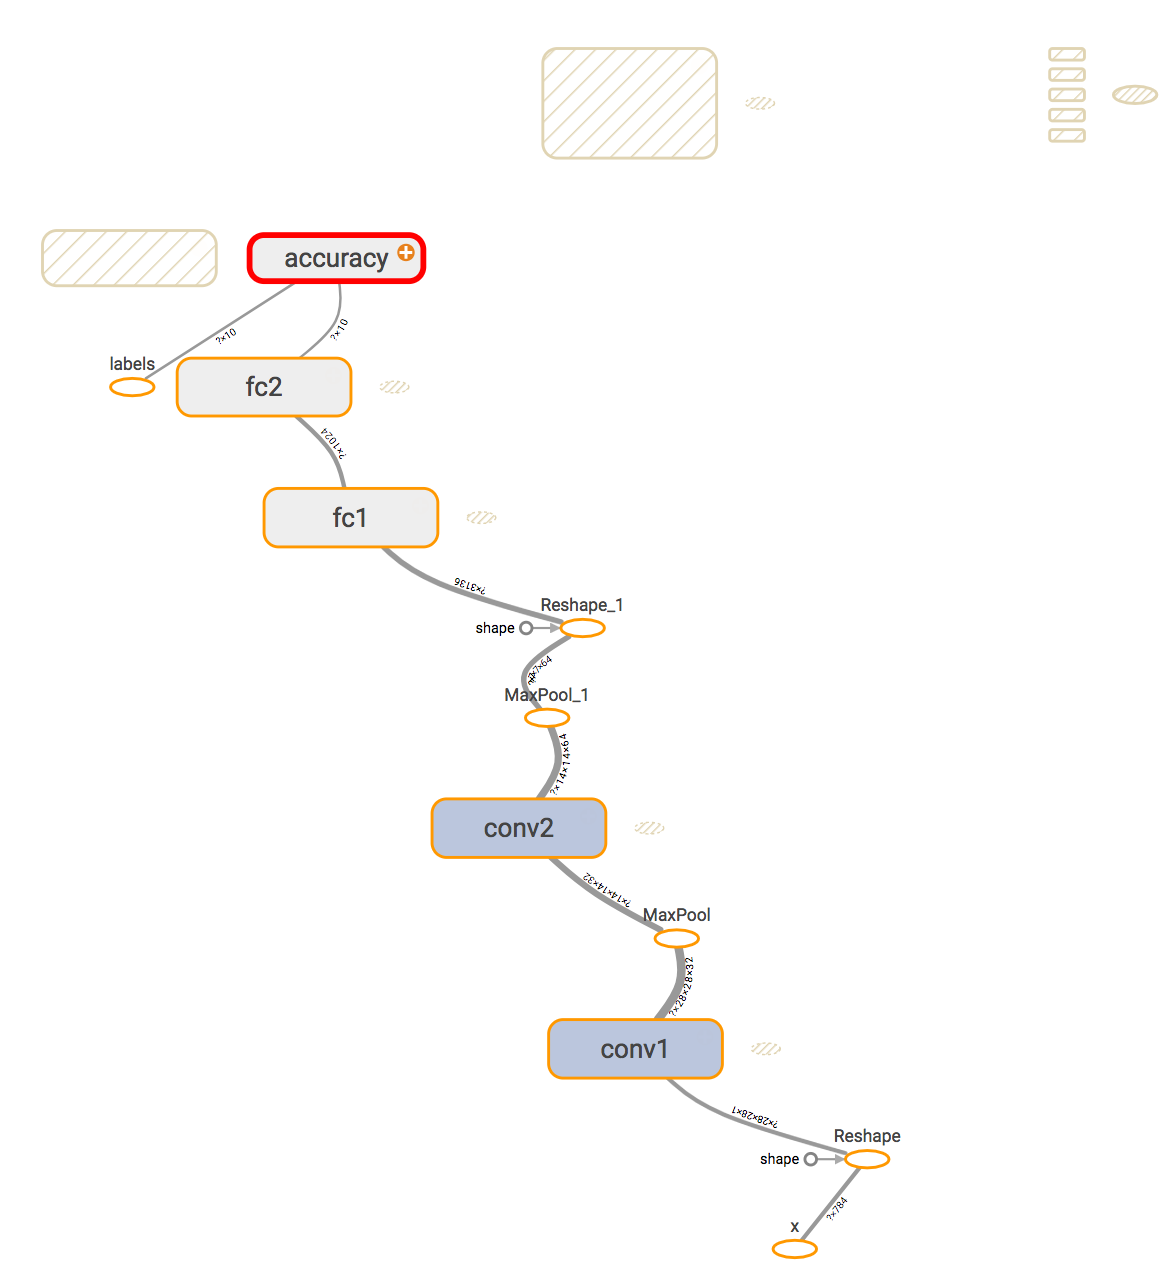
點選左邊的Trace inputs,可以檢視資料到某一模組的流向,例如計算accuracy,是x經過了一系列網路層並比對label計算出來的。
標量,直方圖
除了畫出模型的計算圖外,TensorBoard還支援收集一些準確率、損失等標量資訊,檢查輸入的影象,以及描繪變數的直方圖資訊等等,這些資訊對於評判模型的效能有著重要作用。
我們需要對程式碼做一定修改,來收集這些資訊。
卷積層直方圖
使用tf.summary.histogram收集直方圖資訊。
# 簡單卷積層,為方便本章教程敘述,固定部分引數
def conv_layer(input,
               channels_in,    # 輸入通道數
               channels_out,   # 輸出通道數
               name='conv'):   # 名稱
    with tf.name_scope(name):
        weights = tf.Variable(tf.truncated_normal([5, 5, channels_in, channels_out],
                                                  stddev=0.05), name='W')
        biases = tf.Variable(tf.constant(0.05, shape=[channels_out]), name='B')
        conv = tf.nn.conv2d(input, filter=weights, strides=[1, 1, 1, 1], padding='SAME')
        act = tf.nn.relu(conv + biases)

        # 收集以下三個資訊,統計直方圖
        tf.summary.histogram('weights', weights)
        tf.summary.histogram('biases', biases)
        tf.summary.histogram('activations', act)
        return act
交叉熵,準確率,影象輸入
使用tf.summary.scalar收集標量資訊,使用tf.summary.image收集影象。
tf.summary.scalar('cross_entropy', cross_entropy)
tf.summary.scalar('accuracy', accuracy)
tf.summary.image('input', x_image, 3)
儲存這些資訊
使用tf.summary.merge_all(),喂入訓練資料,可以收集以上定義的所有資訊。
tensorboard_dir = 'tensorboard/mnist3'   # 儲存到新的目錄
if not os.path.exists(tensorboard_dir):
    os.makedirs(tensorboard_dir)

merged_summary = tf.summary.merge_all()   # 使用tf.summary.merge_all(),可以收集以上定義的所有資訊
writer = tf.summary.FileWriter(tensorboard_dir)
writer.add_graph(session.graph)
通過訓練進行資料收集
train_batch_size = 100

for i in range(2001):
    x_batch, y_batch = data.train.next_batch(train_batch_size)

    feed_dict = {x: x_batch, y: y_batch}

    if i % 5 == 0:   # 執行merger_summary,使用add_summary寫入資料
        # 這裡的feed_dict應該使用驗證集,但是當前僅作為演示目的,在此不做修改
        s = session.run(merged_summary, feed_dict=feed_dict)
        writer.add_summary(s, i)

    if i % 500 == 0:
        train_accuracy = session.run(accuracy, feed_dict=feed_dict)
        print("迭代輪次: {0:>6}, 訓練準確率: {1:>6.4%}".format(i, train_accuracy))

    session.run(optimizer, feed_dict=feed_dict)
執行tensorboard,指向 tensorboard/mnist3。點選導航欄SCALARS:
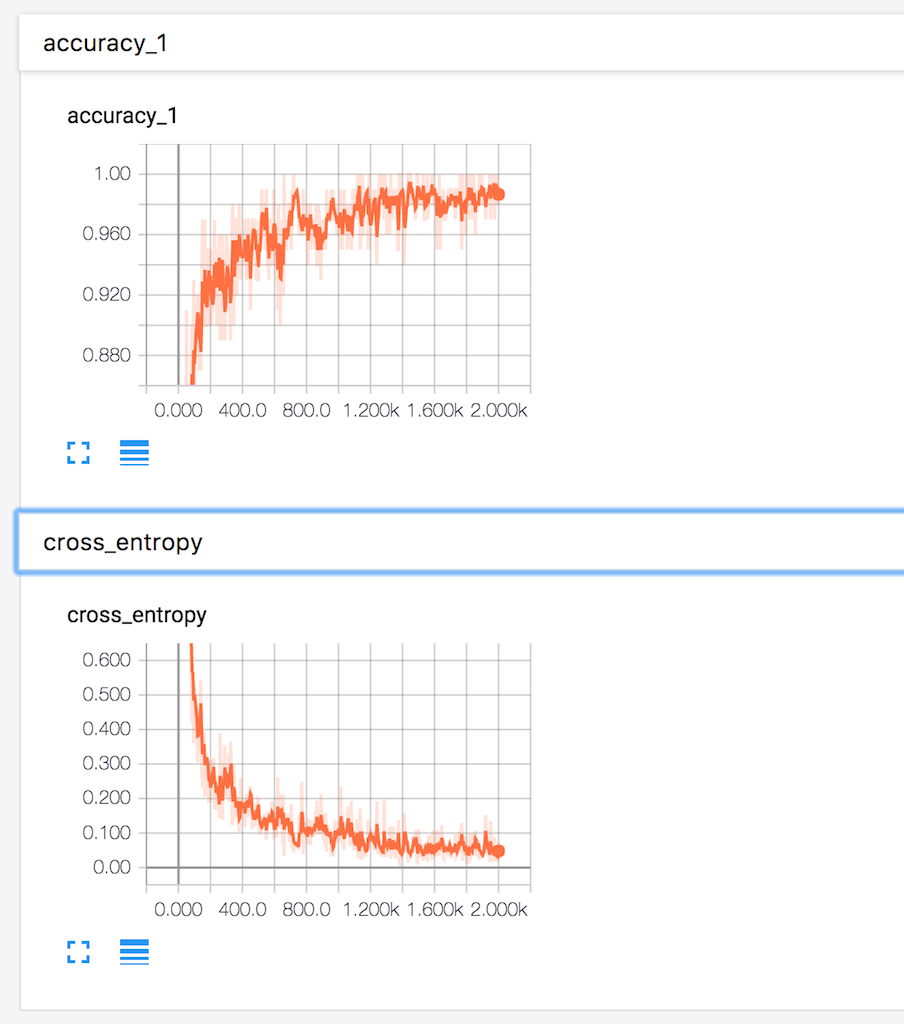
顯示了準確率和交叉熵在迭代過程中的變化情況,準確率在穩步上升,交叉熵逐漸下降,可見該模型的效果還算理想。
點選導航欄HISTOGRAMS:
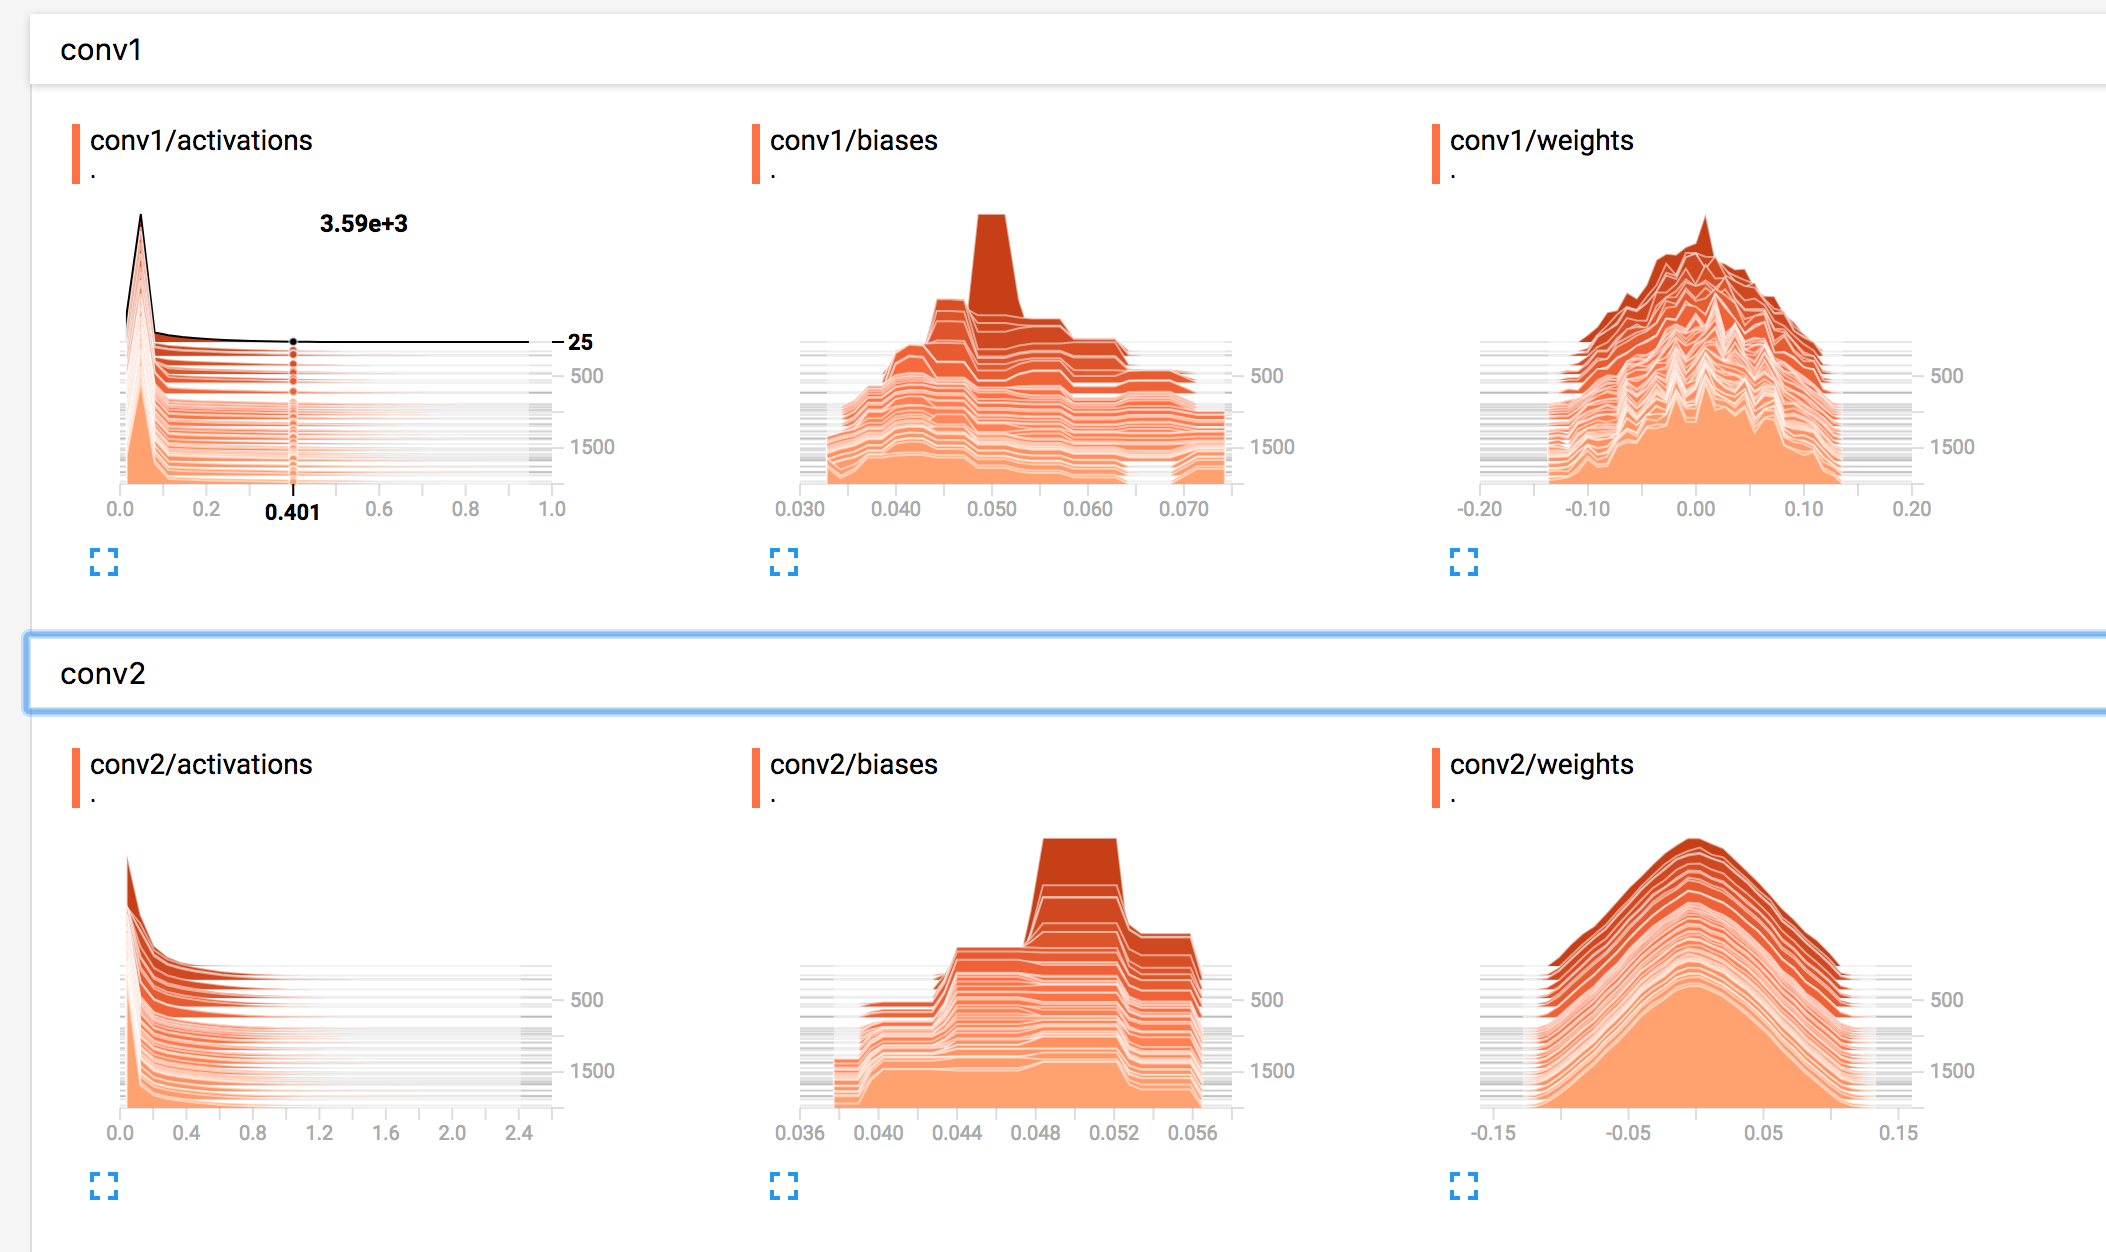
可以檢視變數在不同迭代輪次的直方圖分佈情況。第一層卷積的權重隨著迭代變化較為明顯,第二層表現出平滑的趨勢。
點選導航欄IMAGES,可以顯示不同迭代輪次的3張圖片:

引數搜尋
以上的示例中,TensorBoard都只顯示了一個模型的視覺化資料。對於不同的引數,如何將多個模型顯示在一張圖中進行對比?TensorBoard對這一問題作了同樣的支援。我們需要調整部分程式碼,並加入一些引數搜尋的程式碼。
將 max_pooling 合併到卷積中,將relu從全連線抽離
# 簡單卷積層,為方便本章教程敘述,固定部分引數
def conv_layer(input,
               channels_in,    # 輸入通道數
               channels_out,   # 輸出通道數
               name='conv'):   # 名稱
    with tf.name_scope(name):
        weights = tf.Variable(tf.truncated_normal([5, 5, channels_in, channels_out],
                                                  stddev=0.05), name='W')
        biases = tf.Variable(tf.constant(0.05, shape=[channels_out]), name='B')
        conv = tf.nn.conv2d(input, filter=weights, strides=[1, 1, 1, 1], padding='SAME')
        act = tf.nn.relu(conv + biases)

        tf.summary.histogram('weights', weights)
        tf.summary.histogram('biases', biases)
        tf.summary.histogram('activations', act)

        return tf.nn.max_pool(act, ksize=[1, 2, 2, 1], strides=[1, 2, 2, 1], padding='SAME')

# 簡化全連線層
def fc_layer(input, num_inputs, num_outputs, name='fc'):
    with tf.name_scope(name):
        weights = tf.Variable(tf.truncated_normal([num_inputs, num_outputs],
                                                  stddev=0.05), name='W')
        biases = tf.Variable(tf.constant(0.05, shape=[num_outputs]), name='B')
        act = tf.matmul(input, weights) + biases

        tf.summary.histogram('weights', weights)
        tf.summary.histogram('biases', biases)
        tf.summary.histogram('activations', act)

        return act
儲存到新的目錄
tensorboard_dir = 'tensorboard/mnist4/'   # 儲存目錄
if not os.path.exists(tensorboard_dir):
    os.makedirs(tensorboard_dir)
根據不同引數構建模型
def mnist_model(learning_rate, use_two_fc, use_two_conv, hparam):
    tf.reset_default_graph()    # 重置計算圖
    sess = tf.Session()

    x = tf.placeholder(tf.float32, shape=[None, 784], name="x")
    x_image = tf.reshape(x, [-1, 28, 28, 1])
    tf.summary.image('input', x_image, 3)
    y = tf.placeholder(tf.float32, shape=[None, 10], name="labels")

    if use_two_conv:    # 是否使用兩個卷積
        conv1 = conv_layer(x_image, 1, 32, "conv1")
        conv_out = conv_layer(conv1, 32, 64, "conv2")
    else:
        conv1 = conv_layer(x_image, 1, 64, "conv")    # 如果使用一個卷積,則再新增一個max_pooling保證維度相通
        conv_out = tf.nn.max_pool(conv1, ksize=[1, 2, 2, 1], strides=[1, 2, 2, 1], padding="SAME")

    flattened = tf.reshape(conv_out, [-1, 7 * 7 * 64])

    if use_two_fc:    # 是否使用兩個全連線
        fc1 = fc_layer(flattened, 7 * 7 * 64, 1024, "fc1")
        relu = tf.nn.relu(fc1)
        tf.summary.histogram("fc1/relu", relu)
        logits = fc_layer(fc1, 1024, 10, "fc2")
    else:
        logits = fc_layer(flattened, 7*7*64, 10, "fc")

    with tf.name_scope("xent"):
        xent = tf.reduce_mean(
            tf.nn.softmax_cross_entropy_with_logits(
                logits=logits, labels=y), name="xent")
        tf.summary.scalar("xent", xent)

    with tf.name_scope("train"):
        train_step = tf.train.AdamOptimizer(learning_rate).minimize(xent)

    with tf.name_scope("accuracy"):
        correct_prediction = tf.equal(tf.argmax(logits, 1), tf.argmax(y, 1))
        accuracy = tf.reduce_mean(tf.cast(correct_prediction, tf.float32))
        tf.summary.scalar("accuracy", accuracy)

    summ = tf.summary.merge_all()    # 收集所有的summary

    saver = tf.train.Saver()     # 儲存訓練過程

    sess.run(tf.global_variables_initializer())
    writer = tf.summary.FileWriter(tensorboard_dir + hparam)
    writer.add_graph(sess.graph)

    for i in range(2001):
        batch = data.train.next_batch(100)
        if i % 5 == 0:   # 每5輪寫入一次
            # 同上,feed_dict應該使用驗證集,但是當前僅作為演示目的,在此不做修改
            [train_accuracy, s] = sess.run([accuracy, summ], feed_dict={x: batch[0], y: batch[1]})
            writer.add_summary(s, i)

        if i % 100 == 0:    # 每100輪儲存依存訓練過程
            train_accuracy = sess.run(accuracy, feed_dict={x: batch[0], y: batch[1]})
            saver.save(sess, os.path.join(tensorboard_dir, "model.ckpt"), i)

            print("迭代輪次: {0:>6}, 訓練準確率: {1:>6.4%}".format(i, train_accuracy))

        sess.run(train_step, feed_dict={x: batch[0], y: batch[1]})
以下函式用於生成超引數的字串:
def make_hparam_string(learning_rate, use_two_fc, use_two_conv):
    conv_param = "conv=2" if use_two_conv else "conv=1"
    fc_param = "fc=2" if use_two_fc else "fc=1"
    return "lr_%.0E,%s,%s" % (learning_rate, conv_param, fc_param)
開始訓練:
for learning_rate in [1E-3, 1E-4, 1e-5]:
    for use_two_fc in [False, True]:
        for use_two_conv in [False, True]:
            hparam = make_hparam_string(learning_rate, use_two_fc, use_two_conv)
            print('Starting run for %s' % hparam)

            mnist_model(learning_rate, use_two_fc, use_two_conv, hparam)

print('Done training!')
在訓練過程中即可直接開啟tensorboard實時檢視訓練情況:
$ tensorboard --logdir tensorboard/mnist4
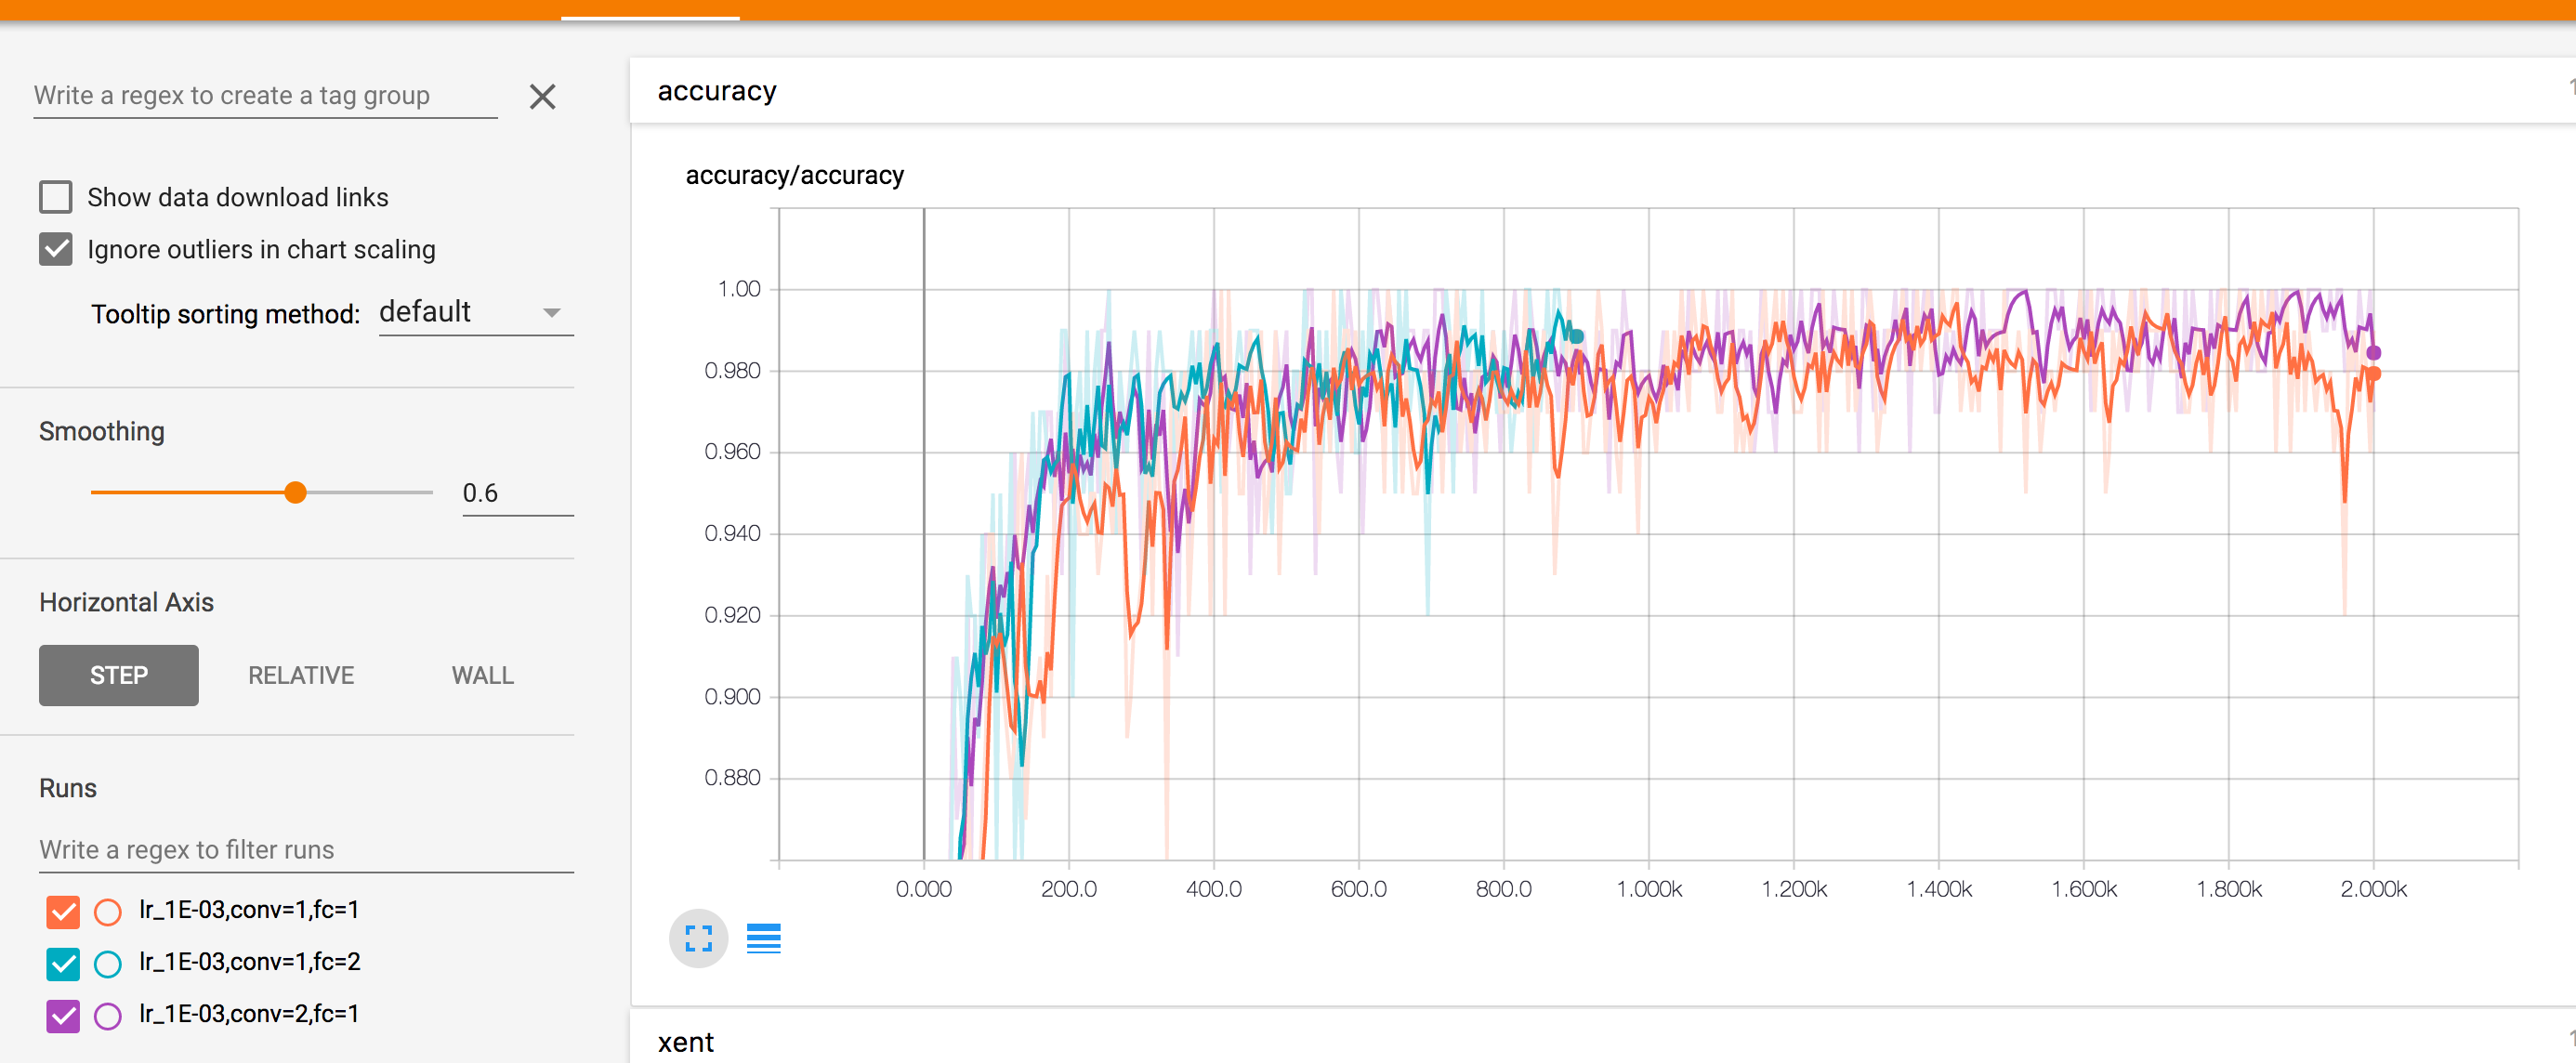
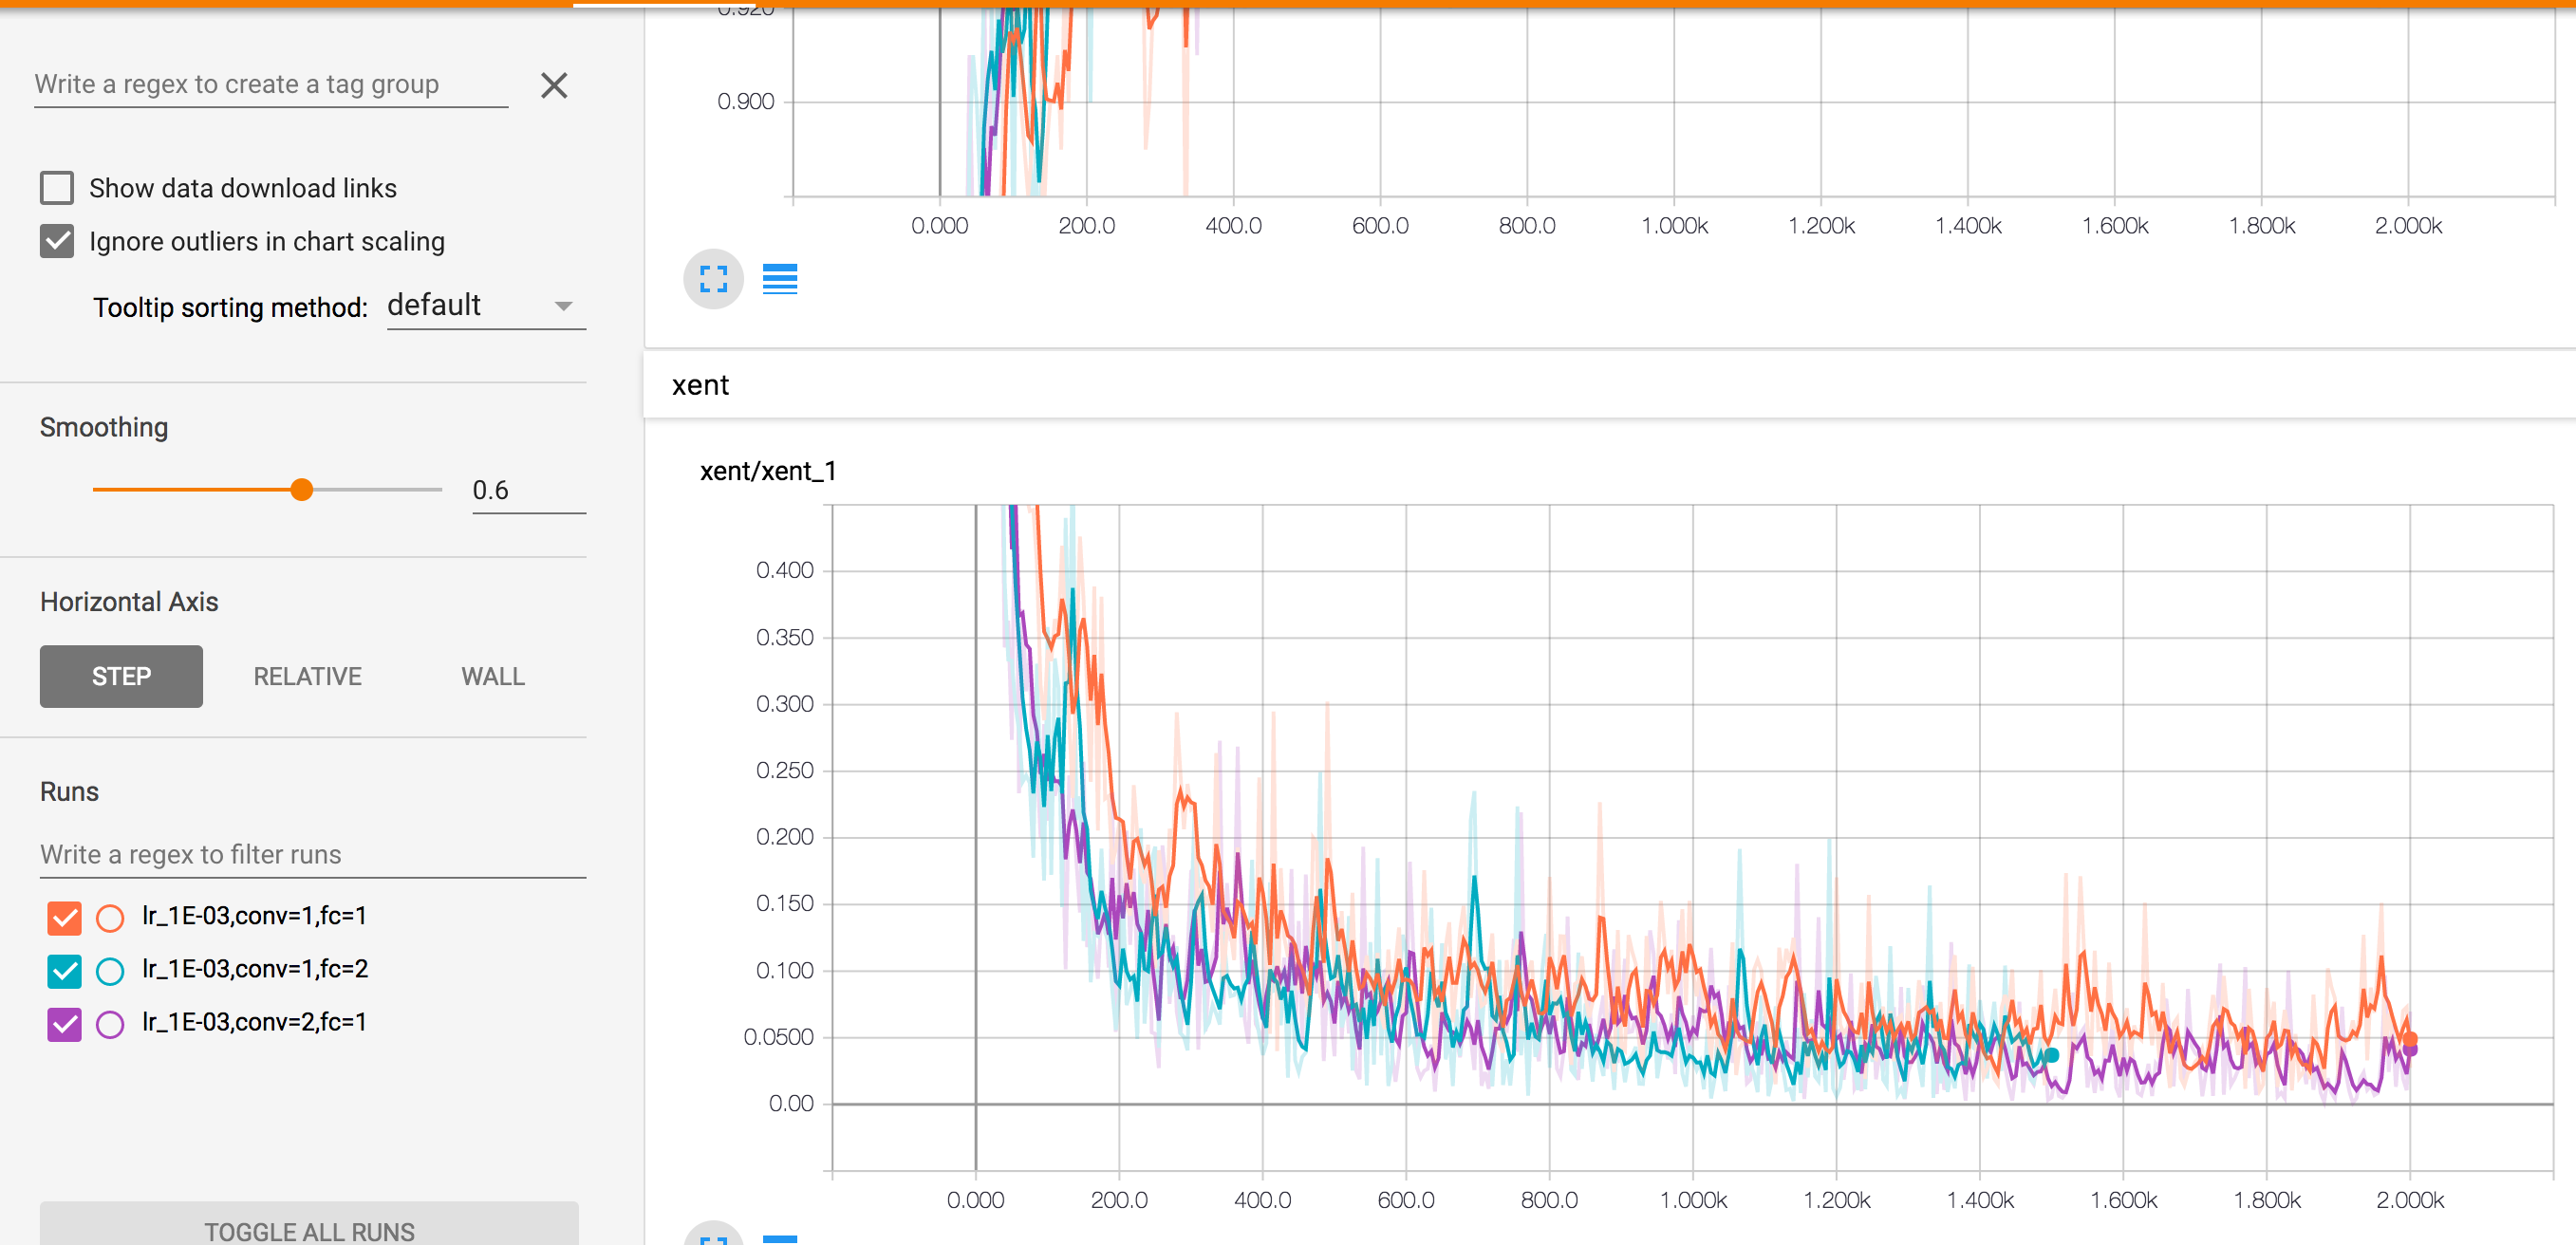
以上就顯示了不同引數情況下的準確率和交叉熵變化情況,左下角區域可以選擇顯示幾條線。中間的Horizontal Axis同樣給了三種不同的顯示,STEP按步長,RELATIVE按相對時間,WALL將它們分開顯示。滑鼠移動到影象上,會給出部分的詳細資訊:
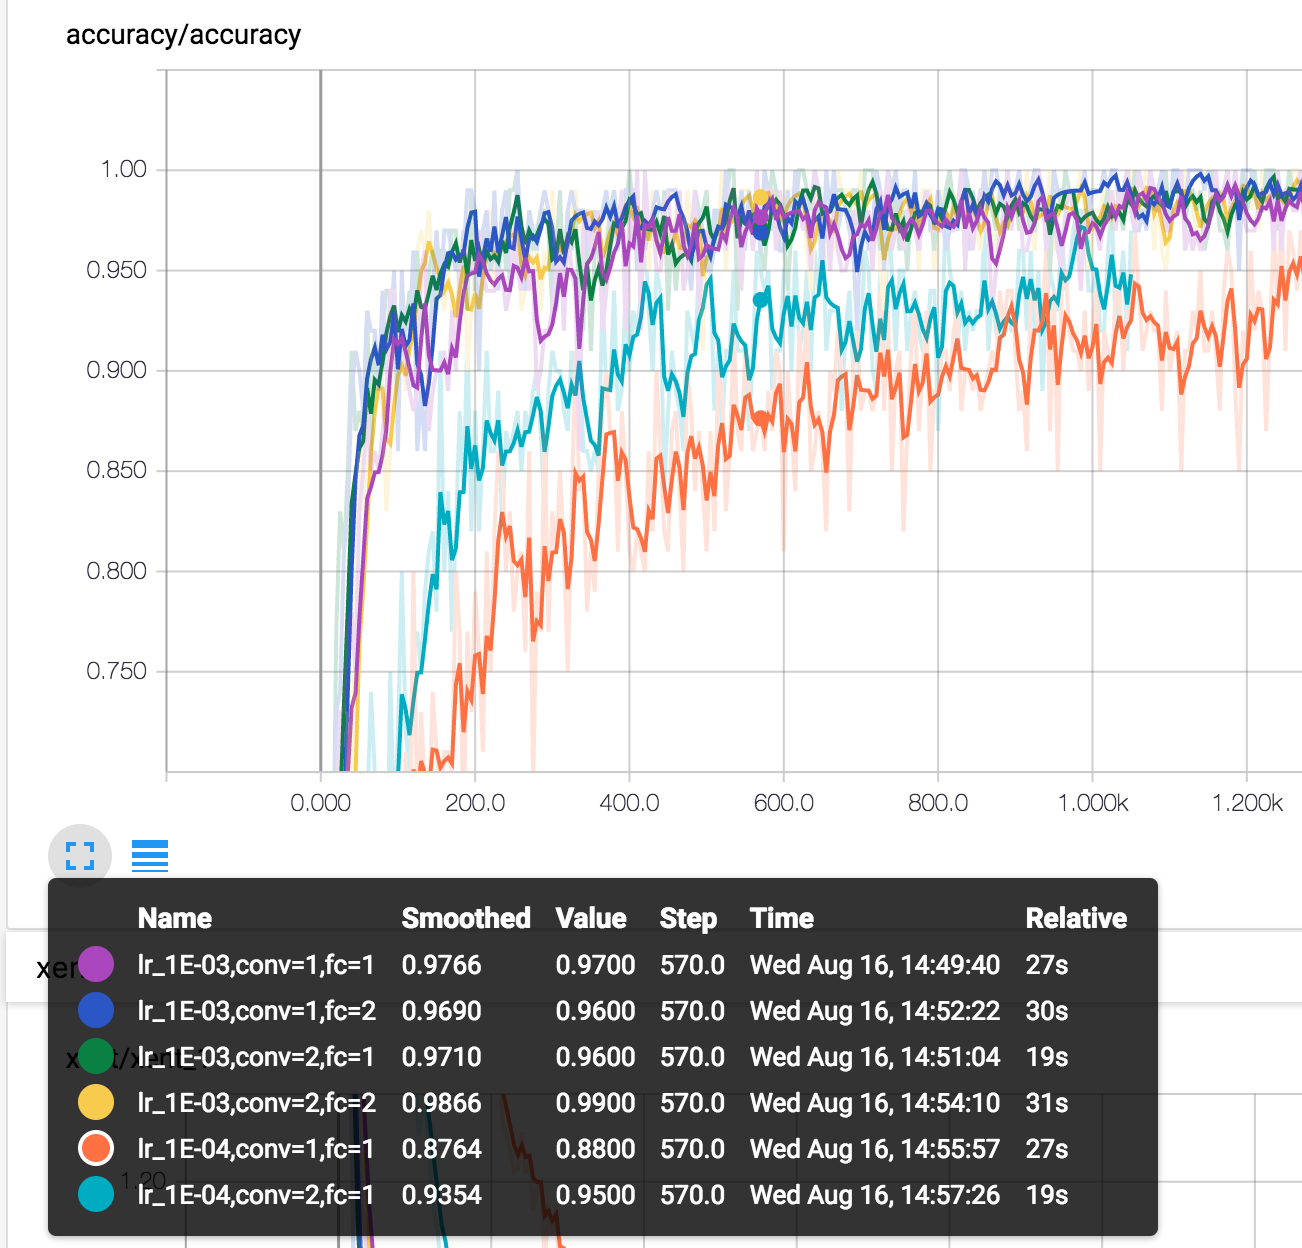
其他幾個部分也是如此,不再詳述。
Embeddings
Embeddings可能是TensorBoard最驚豔的部分。它顯示了訓練樣本在三維空間的距離。如下圖所示:
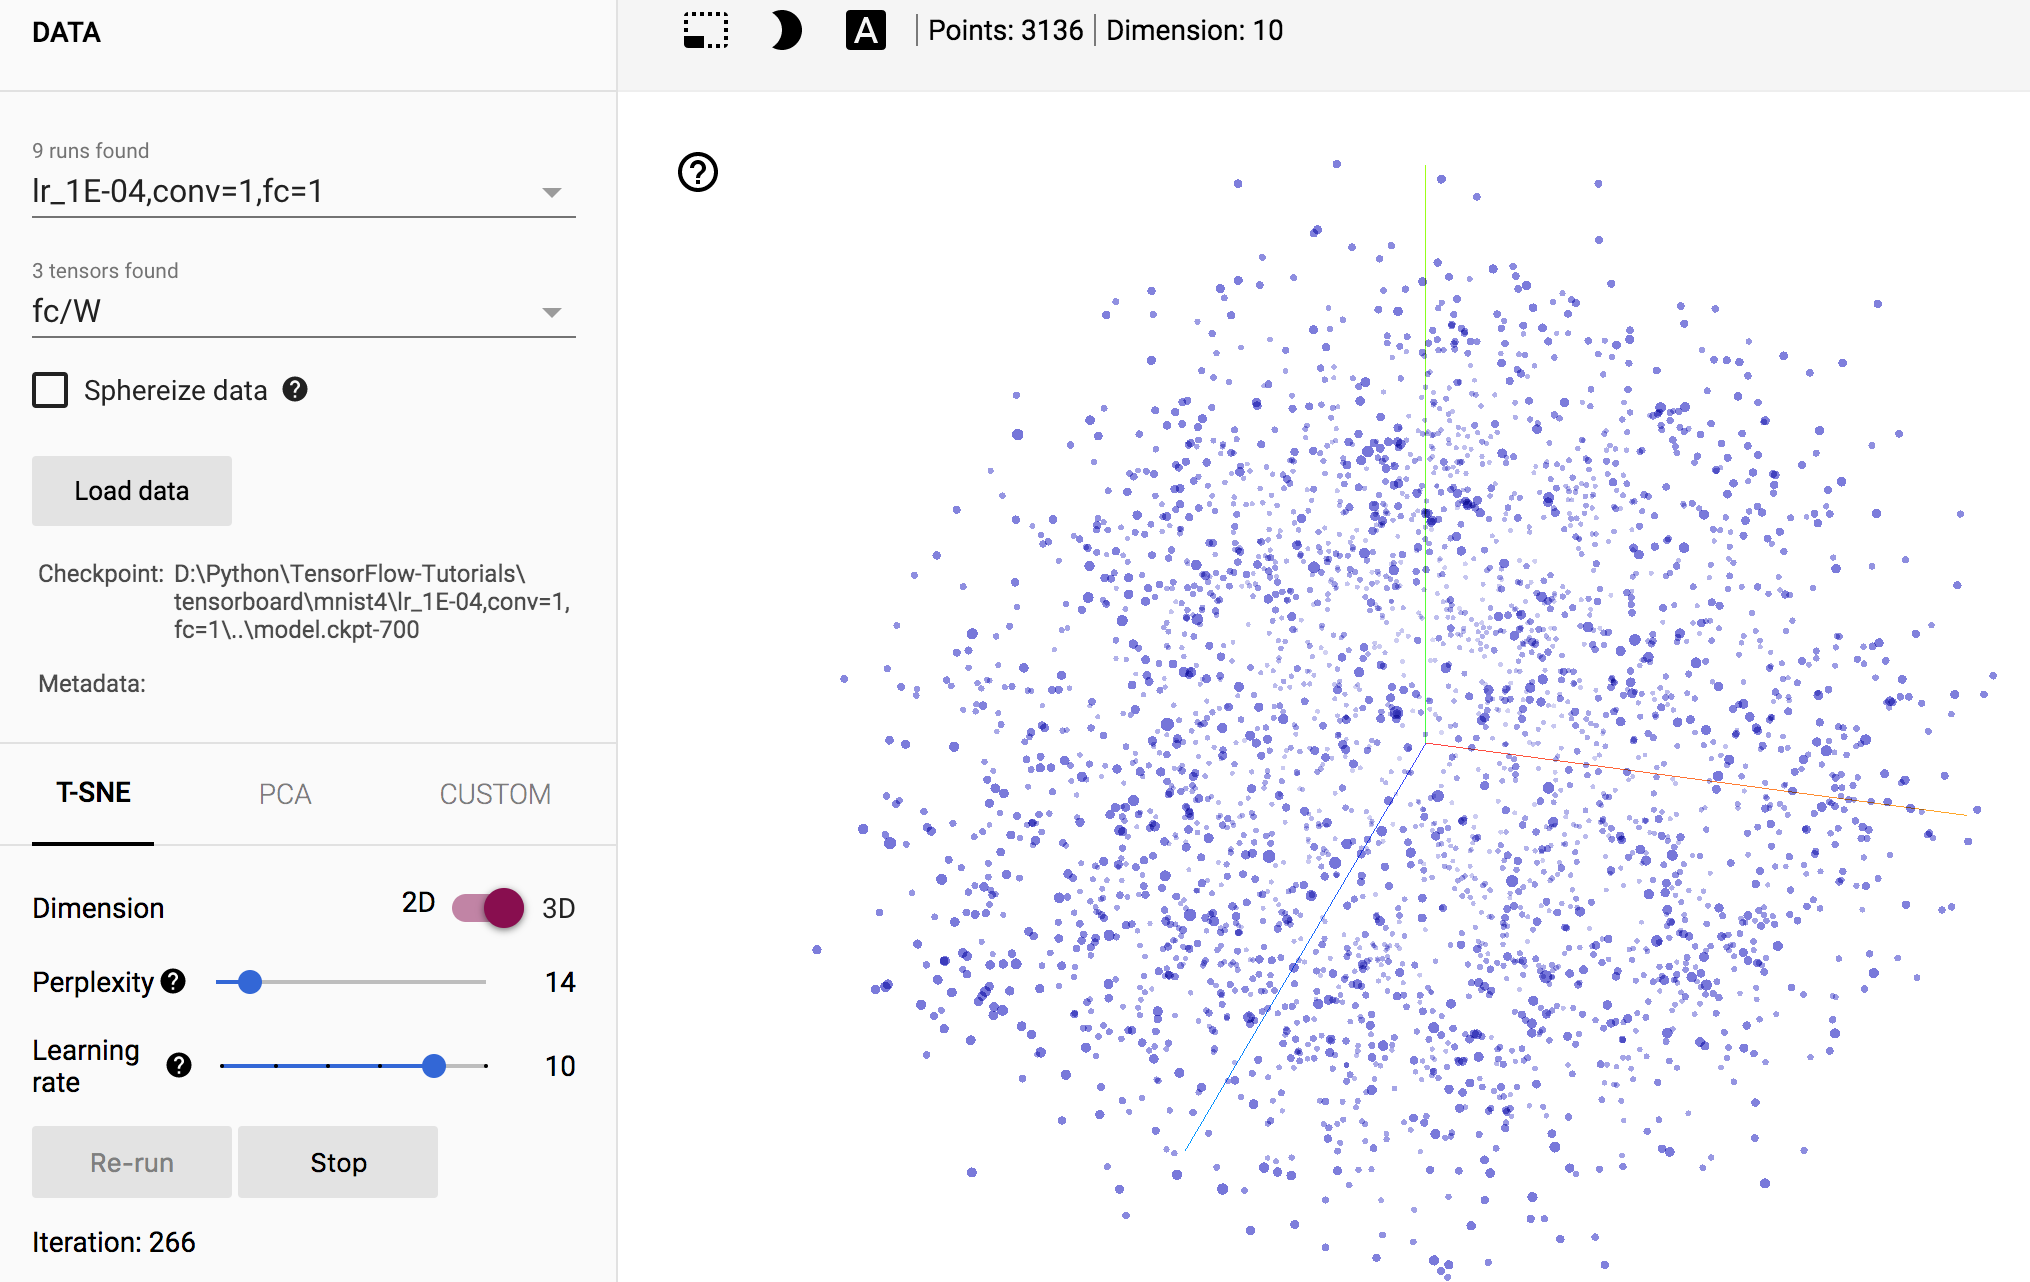
但是目前我們無法確定某個樣本的標籤,因此無法確認。需要對程式碼做一定的修改。
這裡只顯示1024張圖片,需要兩個額外的檔案,一個儲存標籤,一個儲存每個點的縮圖。這兩個檔案可以在dandelionmane的GitHub下載。
LABELS = os.path.join(os.getcwd(), "labels_1024.tsv")
SPRITES = os.path.join(os.getcwd(), "sprite_1024.png")

def mnist_model(learning_rate, use_two_fc, use_two_conv, hparam):
    tf.reset_default_graph()    # 重置計算圖
    sess = tf.Session()

    x = tf.placeholder(tf.float32, shape=[None, 784], name="x")
    x_image = tf.reshape(x, [-1, 28, 28, 1])
    tf.summary.image('input', x_image, 3)
    y = tf.placeholder(tf.float32, shape=[None, 10], name="labels")

    if use_two_conv:    # 是否使用兩個卷積
        conv1 = conv_layer(x_image, 1, 32, "conv1")
        conv_out = conv_layer(conv1, 32, 64, "conv2")
    else:
        conv1 = conv_layer(x_image, 1, 64, "conv")    # 如果使用一個卷積,則再新增一個max_pooling保證維度相通
        conv_out = tf.nn.max_pool(conv1, ksize=[1, 2, 2, 1], strides=[1, 2, 2, 1], padding="SAME")

    flattened = tf.reshape(conv_out, [-1, 7 * 7 * 64])

    if use_two_fc:    # 是否使用兩個全連線
        fc1 = fc_layer(flattened, 7 * 7 * 64, 1024, "fc1")
        relu = tf.nn.relu(fc1)
        embedding_input = relu
        tf.summary.histogram("fc1/relu", relu)
        embedding_size = 1024
        logits = fc_layer(fc1, 1024, 10, "fc2")
    else:
        embedding_input = flattened   # 新新增的embedding_input和embedding_size
        embedding_size = 7*7*64
        logits = fc_layer(flattened, 7*7*64, 10, "fc")

    with tf.name_scope("xent"):
        xent = tf.reduce_mean(
            tf.nn.softmax_cross_entropy_with_logits(
                logits=logits, labels=y), name="xent")
        tf.summary.scalar("xent", xent)

    with tf.name_scope("train"):
        train_step = tf.train.AdamOptimizer(learning_rate).minimize(xent)

    with tf.name_scope("accuracy"):
        correct_prediction = tf.equal(tf.argmax(logits, 1), tf.argmax(y, 1))
        accuracy = tf.reduce_mean(tf.cast(correct_prediction, tf.float32))
        tf.summary.scalar("accuracy", accuracy)

    summ = tf.summary.merge_all()    # 收集所有的summary

    # 新增embedding變數
    embedding = tf.Variable(tf.zeros([1024, embedding_size]), name="test_embedding")
    assignment = embedding.assign(embedding_input)
    saver = tf.train.Saver()     # 儲存訓練過程

    sess.run(tf.global_variables_initializer())
    writer = tf.summary.FileWriter(tensorboard_dir + hparam)
    writer.add_graph(sess.graph)

    # embedding的配置,詳見官方文件
    config = tf.contrib.tensorboard.plugins.projector.ProjectorConfig()
    embedding_config = config.embeddings.add()
    embedding_config.tensor_name = embedding.name
    embedding_config.sprite.image_path = SPRITES
    embedding_config.metadata_path = LABELS
    # Specify the width and height of a single thumbnail.
    embedding_config.sprite.single_image_dim.extend([28, 28])
    tf.contrib.tensorboard.plugins.projector.visualize_embeddings(writer, config)

    for i in range(2001):
        batch = data.train.next_batch(100)
        if i % 5 == 0:   # 每5輪寫入一次
            # 同樣,最好使用驗證集
            [train_accuracy, s] = sess.run([accuracy, summ], feed_dict={x: batch[0], y: batch[1]})
            writer.add_summary(s, i)

        if i % 100 == 0:    # 每100輪儲存依存訓練過程
            sess.run(assignment, feed_dict={x: data.test.images[:1024], y: data.test.labels[:1024]})
            train_accuracy = sess.run(accuracy, feed_dict={x: batch[0], y: batch[1]})
            saver.save(sess, os.path.join(tensorboard_dir, "model.ckpt"), i)

            print("迭代輪次: {0:>6}, 訓練準確率: {1:>6.4%}".format(i, train_accuracy))

        sess.run(train_step, feed_dict={x: batch[0], y: batch[1]})
初始執行時,樣本基本分散在空間中,沒有什麼特殊的規律:
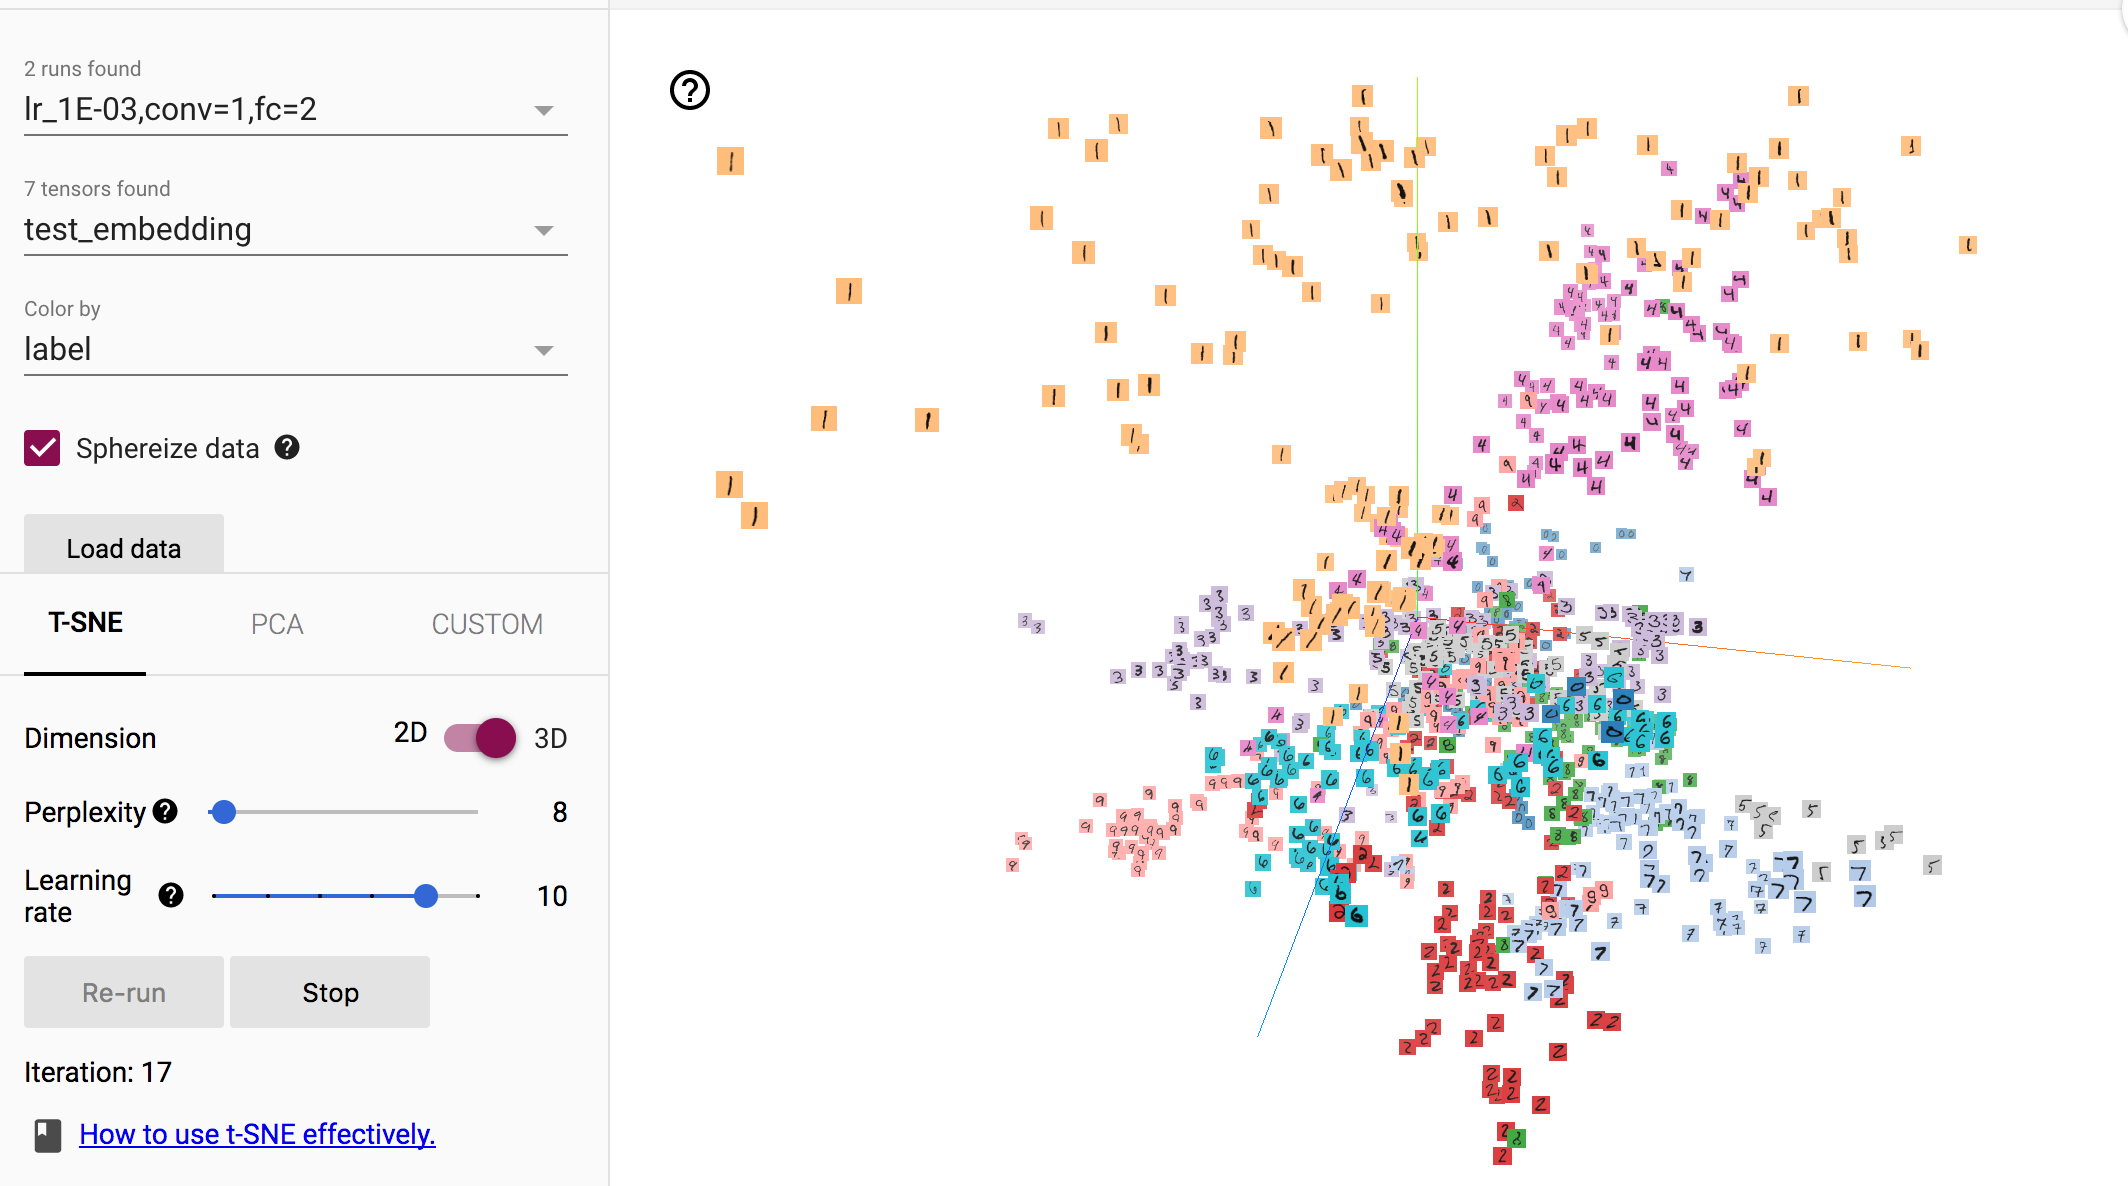
在經過多輪的迭代後,相同類別的樣本聚集在了一起,不同類別的樣本分散開來,呈現聚類趨勢,雖然存在部分的誤分樣本。
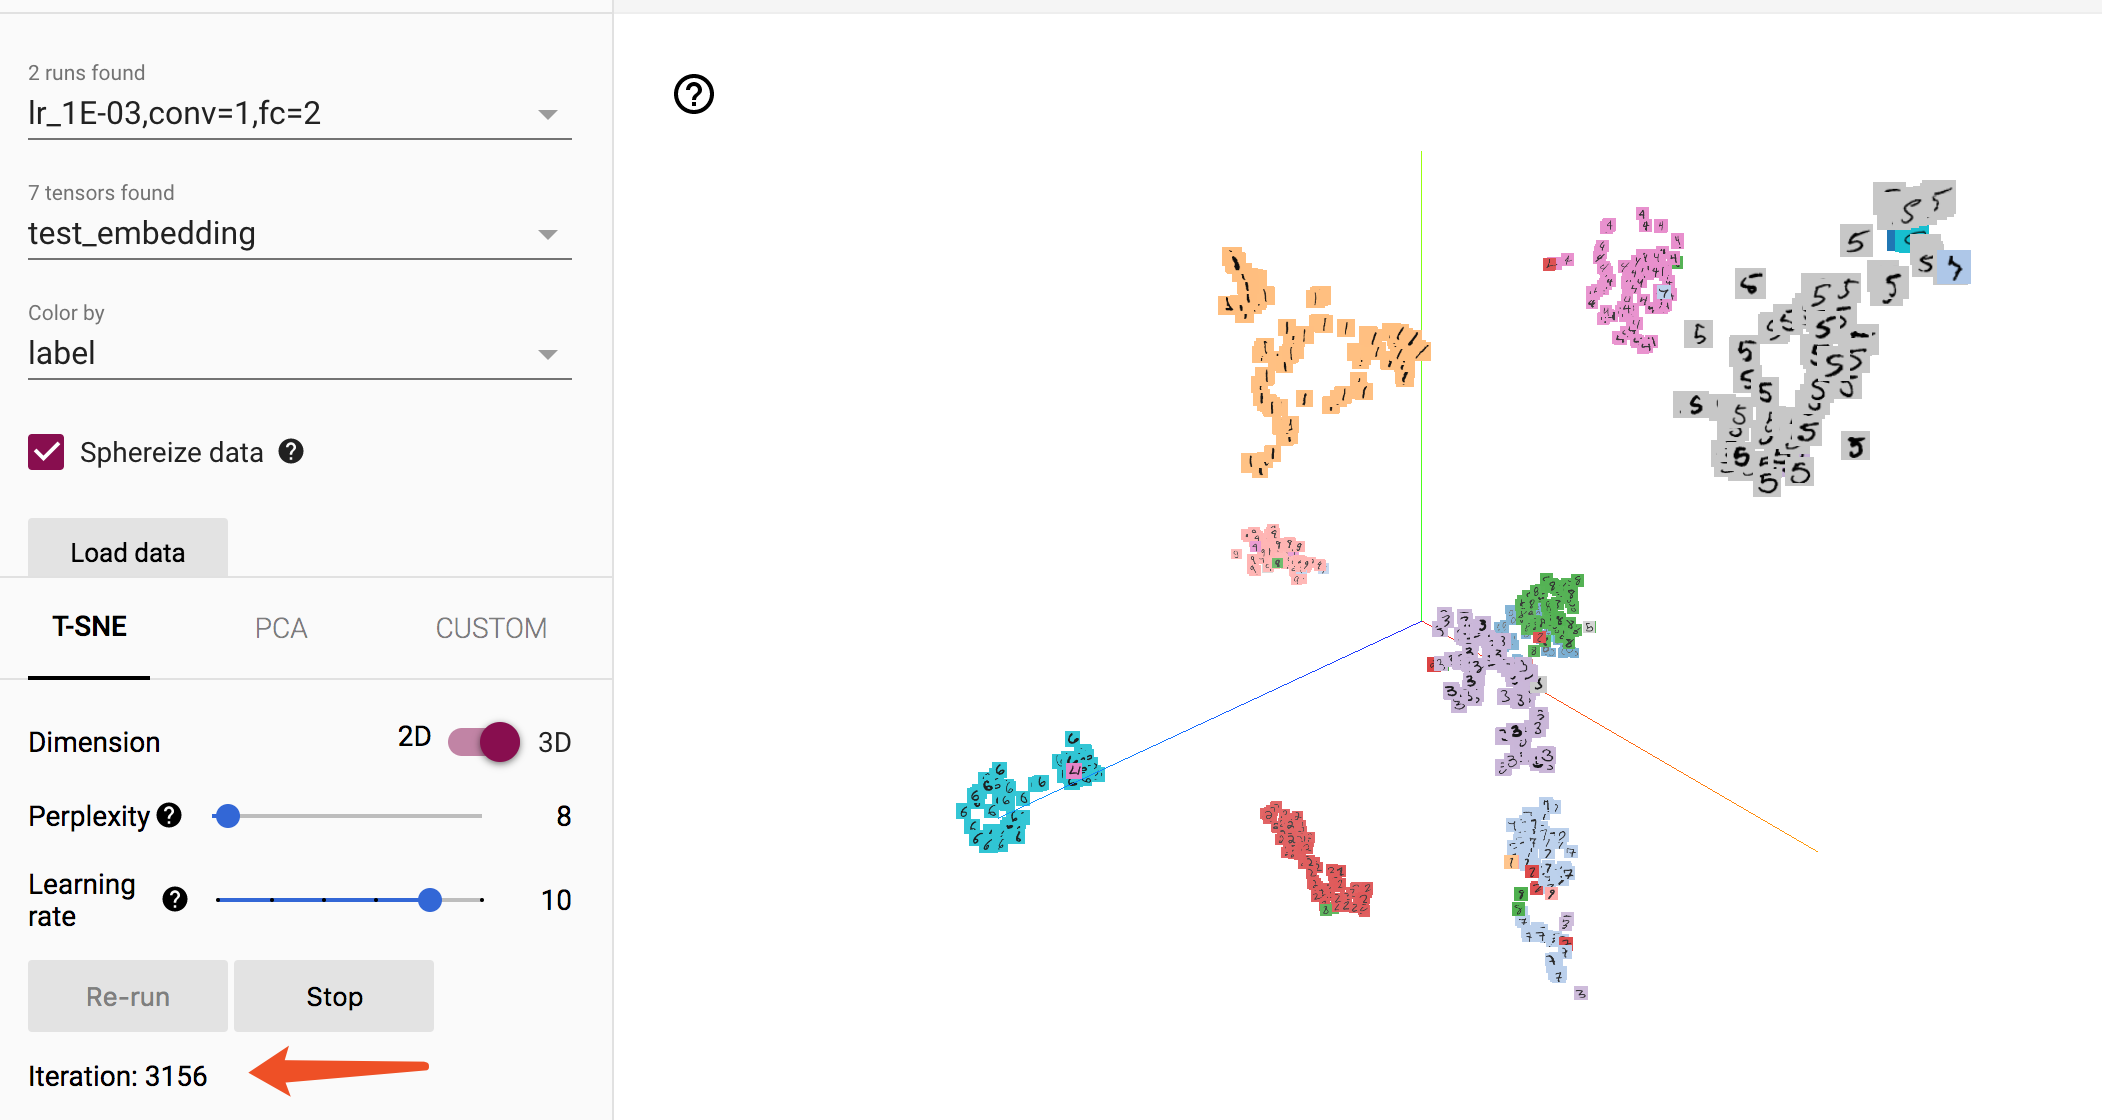
可見,Embedding能夠反映聚類的屬性,這對我們觀察分類效能有很直觀的幫助。Embedding常用在文字中,例如判斷詞向量的相似程度。
