Serverless Streaming At Scale with Cosmos DB
Serverless Streaming At Scale with Cosmos DB
About 100% serverless Kappa Architecture implementation, singletons, scaling, and multi-threading
I’m doing a lot of work on Streaming Processing lately — along with my colleague @Rajasa — and more specifically on the possible implementations of Kappa and Lambda Architectures on Azure. The beauty of Azure is that you have complete freedom to choose the technology you want and you are really not constrained to just one or two options. You really have a lot
Long Story Short
This article is long. There’s a lot of technical stuff in there, and if you’re in hurry, or you already know all the tech things or you don’t really care too much about tech stuff right now, you can just go away with the following key points.
- Serverless streaming at scale is possible and it is easy to set up. As any “at scale” scenarios is has some challenges but they can be mostly solved just by applying the correct configuration
- The sample code will allow you to setup a streaming solution that can ingest almost 1 billion of messages per day in less than 15 minutes. That’s why you should invest in the cloud and in infrastructure-as-code right now. Kudos if you’re already doing that.
- Good coding and optimization skills are still needed if you want to spare some money. Otherwise be prepared to spend big.
- The real challenge is to figure out how to create a balanced architecture. There are quite a few moving part in a streaming end-to-end solution, and all needs to be carefully configured otherwise you may end with bottlenecks one one side, and a lot of unused power on the other. In both cases you’re losing money. Balance is the key.
If you’re now ready for some tech stuff, let’s get started.
The Serveless Way
Since serverless is becoming more and more common — and desired — I decided to setup a Kappa Architecture using Azure Functions as Stream Processing Engine and Cosmos DB as data Serving Layer. Event Hubs provides the Immutable Log support.
100% Serverless Data Streaming Architecture. Will it work? If yes, to which scale? What are the pitfalls? And the best practices? Let’s figure out: setting up everything is quite easy, but there is something tricky in the process, that could make it a little less simple than one would expect. This article is here to help.
Load Test Clients
To generate a stream of data to be processed an option is to use Locust. It is an extremely powerful, yet easy to use, load test tool written in Python. And Python is also the language you need to use to create a load test script that Locust can use to simulate the workload you want. Python is really popular today (and also really powerful and one of my favorite language) so let’s use Locust.
The script I created generates a JSON document that simulates a very simple IoT payload:


In order to make sure I have all the bandwidth needed to simulate even huge workload I used Azure Container Instances (Thanks to Noel for the help in automating it) to host test clients.
At present time, even if Locust offers a master/clients option that allows you to coordinate the work of many clients from the master one, I had to resort to create several standalone clients since the master/slave was sometimes not working as expected. Not sure if it is a Locust or a networking problem, but sometimes the clients could not communicate correctly with the master, making really hard to manage the test environment.
Luckily everything could be easily scripted using AZ CLI and Bash, so no big deal. I plan to revise this code in future, maybe to move to Kubernetes to handle the entire load testing environment.
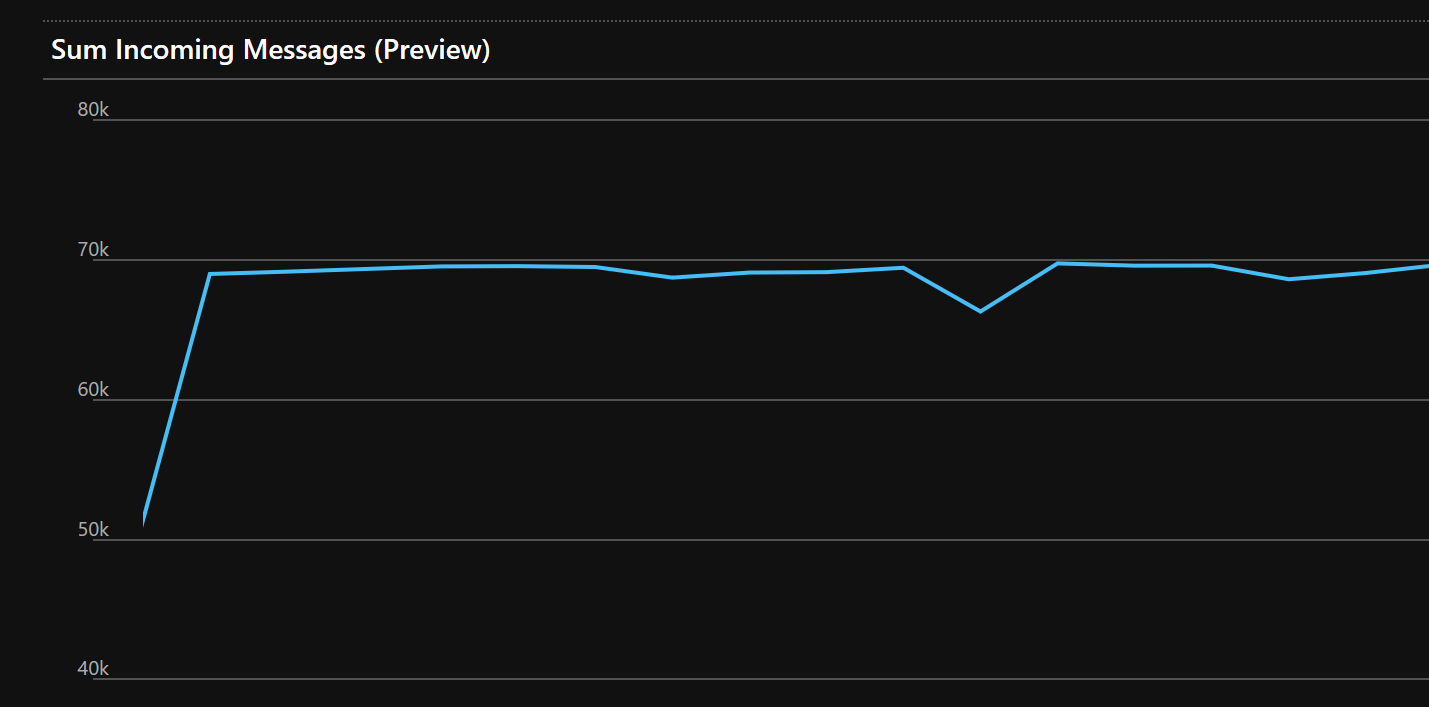
To get started with the solution I decided to create two Locust instances each one simulating 500 users, for a total load of a bit more than 1000 messages/second, or near 70K messages/minute as visible in the metrics:


It’s not a huge load, but it’s great to start without burning all you credit card budget. Once I was confident with the whole solution, I tested everything up to 10K messages/second. Which is almost a billion messages per day. Enough for my tests and for many use cases. And you can always scale up even more if you need to. In the sample code you can find at the end of the article you have settings to test 1K, 5K and 10K messages/seconds. Just don’t blame me about your bill, ok?
Ingesting Data
Event Hubs is one of the possible choices here (others are IoT Hub and Event Grid) and it doesn’t really require a lot of configuration. The main options here are the number of partitions and the throughput units.
In my initial sample, with two test clients and 1000 msg/sec, I went for the Event Hubs Standard tier with 2 throughput units (2Mb/sec ingestion rate, 2000 messages/sec max) and 2 partitions.
Partitions are the key thing here as they cannot be changed on the fly. The problem is that it is also very complex to know in advance how many partitions you’ll really need, since they are strictly tied to how fast your client application can read data our of Event Hubs. So it’s just a trial and error work.
Complex but not impossible. Here’s an helpful indication that my friend Shubha pointed out: the bandwidth provided by the allocated throughput units is spread across all available partitions. So if you allocate 2 throughput units and the you have, say, 8 partitions, each partition will handle only 1/8 of the load. This in turns means that if you also have eight dedicated applications or server instances to consume data coming from a each partition, those instances may just be starving since there may be not enough data to feed them and keep them busy.
Throughput Units will be spread across the available partitions. Make sure you’re not starving the consumers.
Now, let me repeat this, the number of partition then really depend how complex, and thus how fast, your data processing logic can be. If you don’t have a clear idea of which would be the correct number to use, then you can start with this rule of thumb: create an amount of partitions equal to the number of throughput units you have or you might expect to have in future (since you cannot change the partition number once the Event Hub has been created), and then test and monitor the throughput metric of Event Hubs. If the number of processed messages keep up with the incoming messages you’re good. If not, try optimize and/or scale-up (yep, scale-up. Scale-up. You can always scale out later) your consumer application. If you’re using Azure Functions or Spark or a containerized application it’s easy. If this doesn’t solve the problem, then you may want to evaluate the scale out option, that is usually more expensive.
Rule of thumb: create an amount for partitions equal to the number of throughput units you have or you might expect to have in future
On the contrary of what happens with partitions, throughput units can easily be scaled up or down. I decided to go with two in order to have some space to move in case I needed to recover messages not processed. Here’s an example:


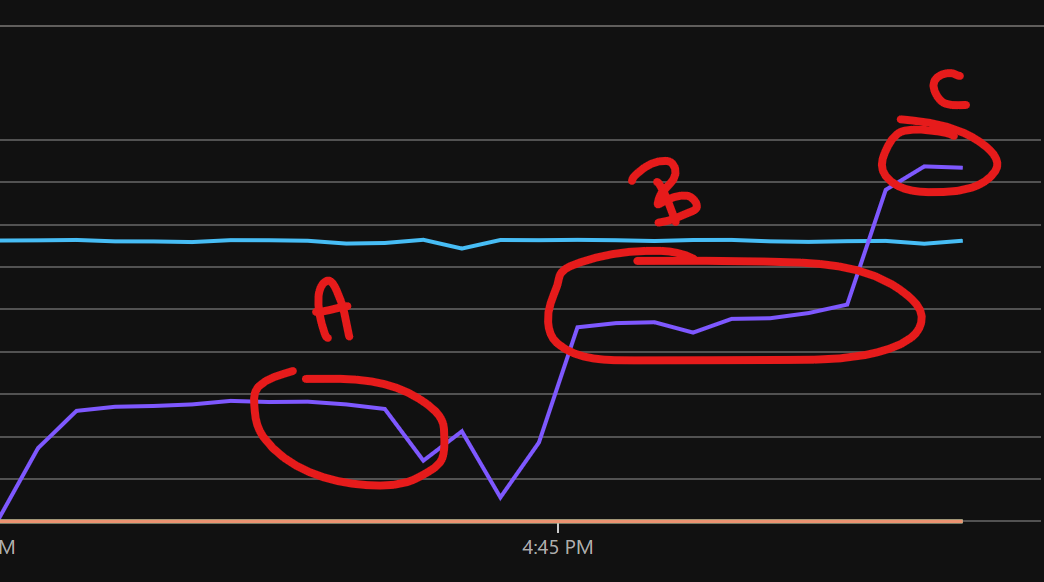
The light blue line represent the throughput of messages being ingested (per minute) while the dark violet color shows the messages consumed. As you can see, I’ve highlighted a case where I needed to restart the stream processing engine and thus messages were accumulated in the Event Hub. As soon as the processing engine was restarted it tried to catch up with the messages accumulated and thus it used more bandwidth then it would normally have done. If you don’t want to pre-allocate too many throughput units you can use the Auto-Inflate option that Event Hubs provides. But I would recommend to allocate a little bit more that the exact number of throughput unit you need so the solution can quickly answer to higher load request. The Auto-Inflate is great but it needs some time to kick-in and if you’re interested in keeping the latency low having a few spare throughput units to use immediately helps a lot.
Another option you may want to evaluate is the Captureoption. It allows to safely store the ingested data into a blob store so that it can be processed later using some batch processing techniques. Perfect for a Lambda Architecture. Also perfect for just doing some data analysis on the fly thanks to the fact that it saves data into a Apache Avro format and thus you can easily use Apache Drill to query it:
Of course also Apache Spark is another option, especially, if you need a more versatile distributed computing platform for your newly create Data Lake. In such case I would recommend Azure Databricks, that can connect to Azure Blob Storage right away:
Streaming Processing
Usually Apache Storm or Apache Spark or Azure Stream Analytics are the to-go options for Stream Processing. But if you don’t need time-aware features, like Hopping or Tumbling Window, complex data processing capabilities, like stream joining, aggregates of streams and the likes, a more lightweight solution can be an option.
If you choose this path you can use Docker, Kubernetes or Service Fabric to create and deploy an application that can manage the incoming stream of data. Or you can go serverless and use Azure Functions.
Thanks to Event Hubs trigger binding for Azure Function it is really easy to setup the function to be called as soon as a message or a batch of messages is ready to be processed. Full documentation is available here:
There is also a Cosmos DB trigger binding available and you may want to test as it simplify your code and generally performs quite well:
But there are cases when you really need to squeeze any bit of performances, or you need more control on how you’re writing to the database, so you may want to use the Cosmos DB SDK manually.
Well, if this is the case keep in mind that when using Cosmos DB SDK directly it is really of paramount importance to use the Singleton pattern to make sure only one instance of DocumentClient is created and then reused by all active threads.
If this should not happen, you’ll get flooded by exception like the following:
Only one usage of each socket address (protocol/network address/port) is normally permitted xxx.xx.xxx.xxx:xxx]
and the performances you’ll get will be awful.
Applying the Singleton Pattern to Cosmos DB DocumentClient object is mandatory to get great performances
So make sure you are wrapping the DocumentClient into a Singleton pattern.
In an heavy multi-threaded environment like Azure Function you really want to make sure that you don’t really create more DocumentClient than what you really need (which is one per worker instance!) so, since there will be many thread running at the same time, you need to make sure that the singleton implementation is thread safe. You can’t use the lock keyword to lock a shared resource and prevent race conditions as Cosmos DB API make heavy usage of the await/async pattern. Luckily, as described here, the SemaphoreSlim class is here to help:
Now is all the manual work really worth? Let’s check with the help of the following picture:


The highlight “A” shows the amount of messages ingested and processed per second by the Azure Function when using the Cosmos DB binding trigger. Good, but in a more high-scale scenario than the initial one, this time with 8 servers running, it wasn’t capable to process enough messages per second to keep up with the messages being pushed to Event Hub (the light blue line you can see in the middle).
Of course I could have increased the number of servers to 32 but that would have impacted significantly on my expenses. And in addition to that, based on what discussed in the Ingestion section on Event Hubs partition strategy, it may even haven’t worked, as the number of partition was set to 16. So, next step is optimization.
By using the Cosmos SDK manually, implementing a thread-safe Singleton Pattern on the DocumentClient object and writing all the document in a batch in parallel I’ve been able to increase by 50% the performances of my solution as you can see from the highlighted section “B”.
Writing in parallel all the documents in the batch almost doubled the performances
It wasn’t still enough to deal with the almost 6000 messages/second I was sending during another test, so I simply scaled up Azure Function to an higher SKU and that’s it. Scaling up took just a matter of seconds. As you can see from the highlighted section “C” I was finally able to have enough compute power to process even more messages that what was actually being pushed in, which it was great since not only I could catch up with messages waiting to be processed, but I was also sure I had enough compute power to handle and higher peak number of messages that may happen here and now.


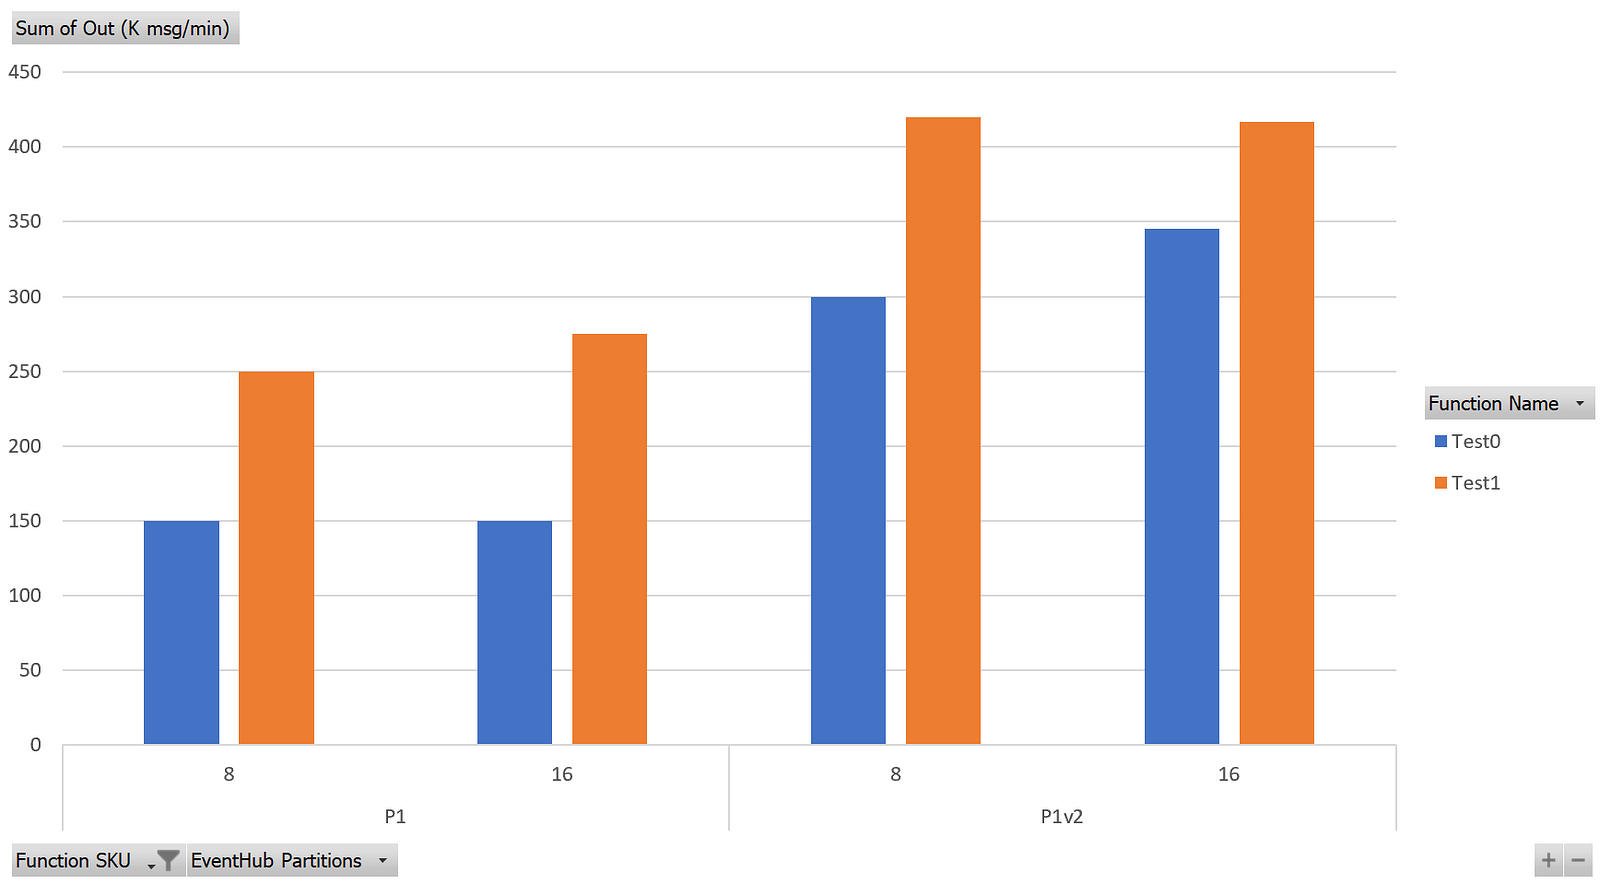
In order to find the most balanced solution, I did several performance tests and I gathered all the tests I’ve done into a chart that helps to summarize the results very well:


The Goal was to process at least 5500 messages per second (or 330K messages/minute) and as you can see, with the optimized code (“Test1” in the chart) I was able to do that with a P1v2 SKU. With the native CosmosDB binding, performance aren’t bad, but a P1v2 SKU is not enough. I reached the goal using a P2v2, which costs twice the P1v2 SKU. Having set up the solution to use 8 workers this means a difference of more than a 1000$ per month! That’s a huge saving for a simple Singleton pattern, isn’t it?
The chart also shows that with the current data processing logic implemented in the function, 8 partitions are the right choice to have a balanced solution, since increasing them doesn’t provide any benefit. On the contrary I’ll be just diluting my available bandwidth for no reason.
I could have easily go why higher than that in terms of ingesting an processing data, just by using higher SKU and increasing the number of throughput units but then I would also have to increase the computer power of the Serving Layer. So let’s talk about that now.
Serving Data
On Cosmos DB a collection with 20000 RU/s (RU: Resource Unit) was created to handle the 1000 insert/second and also allow enough RU/s for querying data.
Why 20000? After having defined the indexes I needed, I did run some tests to measure how many RU a single document insert would have used. I measured a bit more then 6. Let’s say 7. If I want to be able to insert 1000 documents/second and I need 1000*7=7000 RU. Easy. Since I also want to query the data at some point (each document written needs also to be read at once in my scenario), that I can safely assume I may need 14000 RU. Add some space for other queries, and the correct starting RU value for me is 20000 RU. If I’m wrong I can always change it later in almost real time. That’s the real beauty of Cosmos DB to me.
Keep in mind that the 20000 RU is spread across the partition you have, more or less like what happen with Event Hubs. Big difference here is that you cannot decide how many partition you’ll get.
In Cosmos DB you cannot decide how many partitions to have. But still your RUs will be spread across the available partitions.
How partition count is decided is explained in detail here:
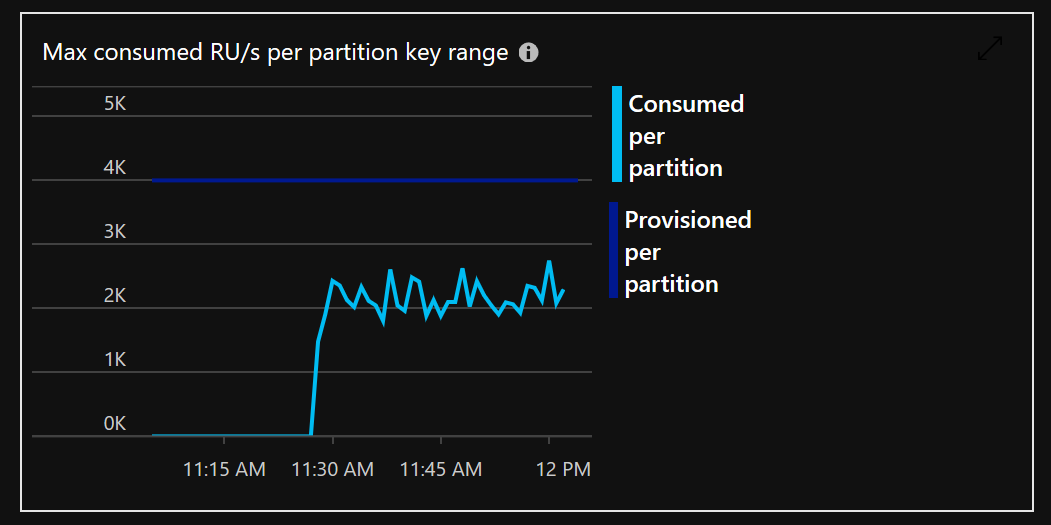
But it’s safe to say that with a 20K RU you’ll almost surely get 5 partitions capable of 4K RU each. This means you have to choose a partition key so that the workload will be evenly distributed, avoiding hot spots on a specific partition, that otherwise would kick in throttling way before the 20K RU limit.
As your data will grow more partition will be added automatically and data distributed among the new partitions.


In my sample test the partition key was set to be the deviceId. This means that all measures from a single device would be sent to the same partition and data will be evenly spread over all available partitions (since the test client were generating data with a even distribution) making sure we don’t hit that 10GB limits per partition that we always have to keep in mind.
This may be good or not depending on your scenario. If you’re mainly interested in reading data of a specific device, then that choice is great since you are only hitting one partition and thus RU usage (meaning: costs) will be the lowest possible and performances the best possible. On the other side, if you’re interested into getting an overview of the status of all devices in the last minute, for example, then using time as the partitioning key would be preferable.
And what if you need both? The answer is that in your processing function you may want to process your data so that a new document with consolidated data coming from all devices is actually generated and stored into another collection for easier querying. Sometimes this process is referred as “materializing a view” of the data into a new collection. In old-fashioned (but still lovely!) relational terms, this would have been called denormalizing. So, just like it happens with relational database, when you denormalize — or materialize processed data into a new document — just keep in mind that it is your responsibility to keep data logically consistent! So always double check your data processing routines.
When we materialize processed data into a new document is our responsibility to keep data logically consistent
Conclusions
There’s not a lot to say: is just as is as it appears, and everything is smooth as long as you remember to correctly implement the Singleton Pattern if you decide to manually use the Cosmos DB SDK.
The most complex things for me to grasp was the Event Hub partitions and Throughput Units, but lucky the Product Group helped me in getting them correctly.
Cosmos DB is complex (behind the scenes) best and I took a while to get the partitioning thing right. I’m so used to the partitions concept in Azure SQL/SQL Server world — the is completely different from Cosmos DB but yet, same word and idea — that for couple of days I really had hard times understanding it, but at some point the light finally turned on.
This article will hopefully help you to get the things right right from the beginning. It will be even easier with the code, right? Right. So here it is: code to setup everything, so that you can try by yourself, is available on GitHub in the cosmos-db folder.
As said at the beginning of this long post (and a special thanks to you if you’re still reading this!), if you’re interested in streaming scenarios, just keep following my blog here as I’ll do more tests with other technologies (Azure SQL, IoT Hub, Azure Data Explorer…) in the near future.
