Automated Canary Analysis at Netflix with Kayenta
Automated Canary Analysis at Netflix with Kayenta
Today, in partnership with Google, we have open sourced Kayenta, a platform for Automated Canary Analysis (ACA). Kayenta leverages lessons learned over the years of delivering rapid and reliable changes into production at Netflix. It is a crucial component of delivery at Netflix as it reduces the risk from making changes in our production environment. In addition, Kayenta has increased developer productivity by providing engineers with a high degree of trust in their deployments.
Automated Canary Analysis
A canary release is a technique to reduce the risk from deploying a new version of software into production. A new version of software, referred to as the canary, is deployed to a small subset of users alongside the stable running version. Traffic is split between these two versions such that a portion of incoming requests are diverted to the canary. This approach can quickly uncover any problems with the new version without impacting the majority of users.
The quality of the canary version is assessed by comparing key metrics that describe the behavior of the old and new versions. If there is significant degradation in these metrics, the canary is aborted and all of the traffic is routed to the stable version in an effort to minimize the impact of unexpected behavior.


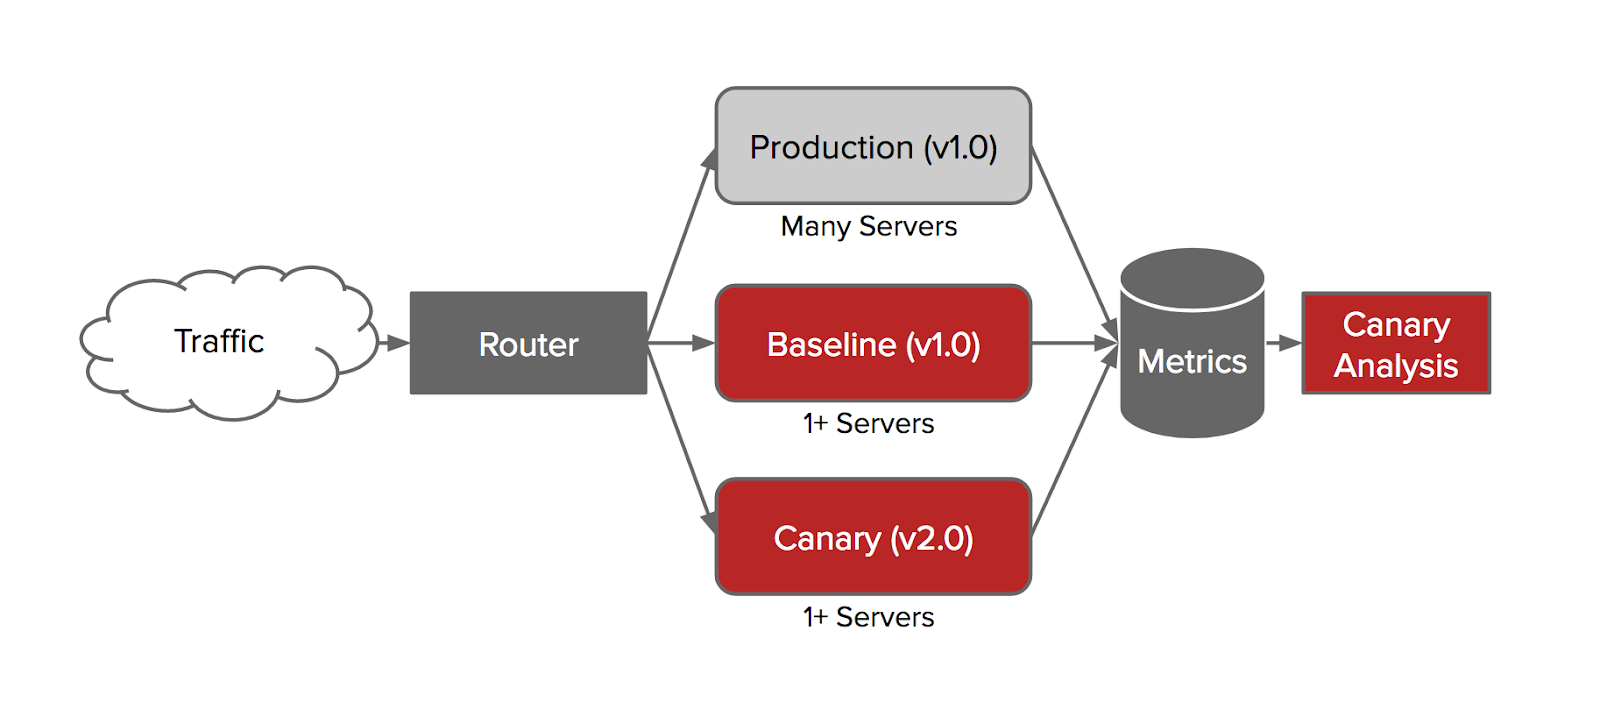
At Netflix, we augment the canary release process and use three clusters, all serving the same traffic with different amounts:
- The production cluster. This cluster is unchanged and is the version of software that is currently running. This cluster may run any number of instances.
- The baseline cluster. This cluster runs the same version of code and configuration as the production cluster. Typically, 3 instances are created.
- The canary cluster. This cluster runs the proposed changes of code or configuration. As in the baseline cluster, 3 instances are typical.
The production cluster receives the majority of traffic, while the baseline and canary each receive a small amount. How this delineation of traffic routing occurs depends on the type of traffic, but a typical configuration leverages a load balancer to add the baseline and canary instances into the regular pool of existing instances.
Note: while it’s possible to use the existing production cluster rather than creating a baseline cluster, comparing a newly created canary cluster to a long-lived production cluster could produce unreliable results. Creating a brand new baseline cluster ensures that the metrics produced are free of any effects caused by long-running processes.
Spinnaker, our continuous delivery platform, handles the lifecycle of the baseline and canary clusters. Moreover, Spinnaker runs one or more iterations of the canary analysis step and makes the decision to continue, rollback, or, in some cases, prompt manual intervention to proceed. If the new version is determined to be safe the deployment is allowed to continue, and the production change is fully rolled out into a new cluster. If not, Spinnaker will abort the canary process and all traffic will be routed to the production cluster.
History of Canary Analysis at Netflix
Canary analysis was initially a manual process for engineers at Netflix. A developer or release engineer would look at graphs and logs from the baseline and canary servers to see how closely the metrics (HTTP status codes, response times, exception counts, load avg, etc.) matched. If the data looked reasonable, a manual judgment was made to move forward or to roll back.
Needless to say, this approach didn’t scale and was not reliable. Each canary meant several hours spent staring at graphs and combing through logs. This made it difficult to deploy new builds more than once or twice a week. Visually comparing graphs made it difficult to see subtle differences between the canary and baseline. Our first attempt at automating canary analysis was a script that was very specific to the application it was measuring. We next attempted to generalize this process and introduced our first version of automated canary analysis more than 5 years ago. Kayenta is an evolution of this system and is based on lessons we have learned over the years of delivering rapid and reliable changes into production at Netflix.
Kayenta
Kayenta is our next-generation automated canary analysis platform and is tightly integrated with Spinnaker. The Kayenta platform is responsible for assessing the risk of a canary release and checks for significant degradation between the baseline and canary. This is comprised of two primary stages: metric retrieval and judgment.
Metric Retrieval
This stage retrieves the key metrics from the baseline and canary clusters. These metrics are typically stored in a time-series database with a set of tags or annotations which identify if the data was collected from the canary or the baseline.
Kayenta takes a configuration file which defines the metric queries. These metrics are combined with a scope (“for this cluster and this time range”) and are used to query one of the available metric sources. The results are then passed to the judge for analysis.
Kayenta currently supports the following metric sources: Prometheus, Stackdriver, Datadog, and Netflix’s Atlas. In addition, different metric sources can be combined in a single analysis, i.e., some metrics may come from one source while other metrics can come from another.
Judgment
This stage compares the metrics collected from the baseline and canary. The output is a decision as to whether the canary passed or failed, i.e., was there a significant degradation in the metrics. Towards this end, there are four main steps as part of judgment which are outlined below.
Data ValidationThe goal of data validation is to ensure that, prior to analysis, there is data for the baseline and canary metrics. For example, if the metric collection stage returns an empty array for either the baseline or canary metric the data validation step will mark the metric as “NODATA” and the analysis moves onto the next metric.
Data CleaningThe data cleaning step prepares the raw metrics for comparison. This entails handling missing values from the input. There are different strategies for handling missing values based on the type of metric. For example, missing values, represented as NaNs, may be replaced with zeros for error metrics while they may be removed for other types of metrics.
Metric ComparisonThe metric comparison step is responsible for comparing the canary and baseline data for a given metric. The output of this step is a classification for each metric indicating if there is a significant difference between the canary and baseline.
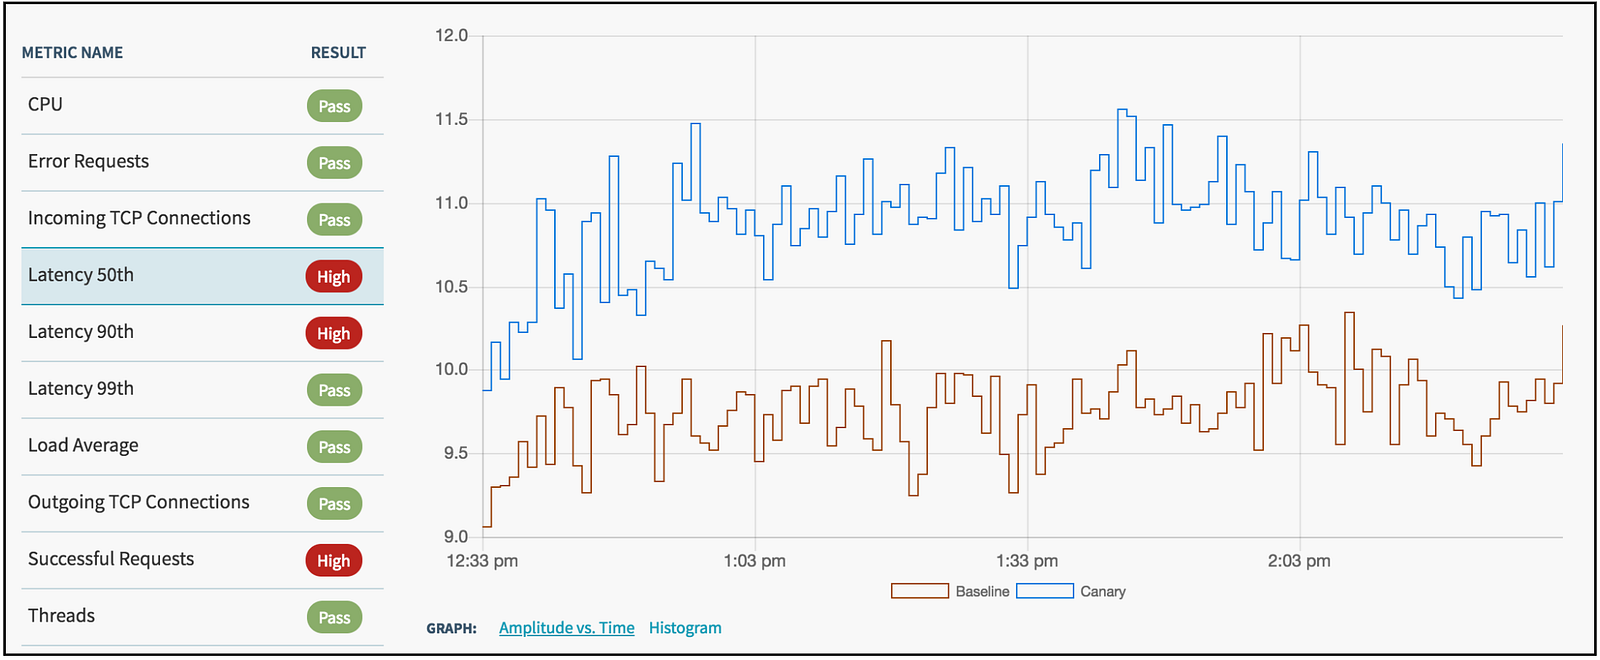
More specifically, each metric is classified as either “Pass”, “High”, or “Low”. A classification of “High” indicates that the canary metric is meaningfully higher than the baseline metric. The following screenshot shows an example where the metric Latency 50th was classified as “High”.


The primary metric comparison algorithm in Kayenta uses confidence intervals, computed by the Mann-Whitney U test, to classify whether a significant difference exists between the canary and baseline metrics.
Score ComputationAfter each metric has been classified a final score is computed. This score represents how similar the canary is to the baseline. This value is used by Spinnaker to determine if the canary should continue or roll back.
The score is calculated as the ratio of metrics classified as “Pass” out of the total number of metrics. For example, if 9 out of 10 metrics are classified as “Pass” then the final canary score would be 90%. While there are more complex scoring methodologies we bias towards techniques which are simple to understand.
Reporting
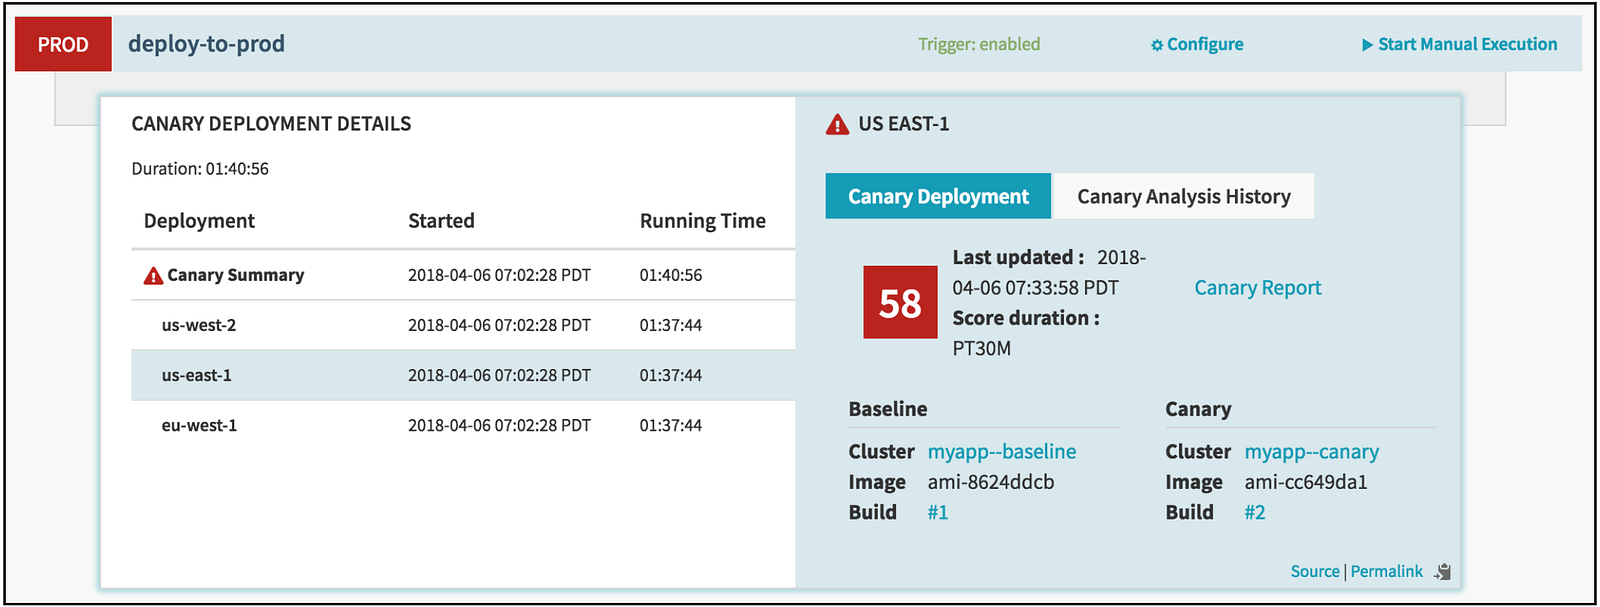
In addition to open sourcing the Kayenta platform, we are also releasing the Spinnaker UI components which integrate Kayenta. This includes a component which integrates the canary score into the Spinnaker pipeline execution details as shown in the image below.


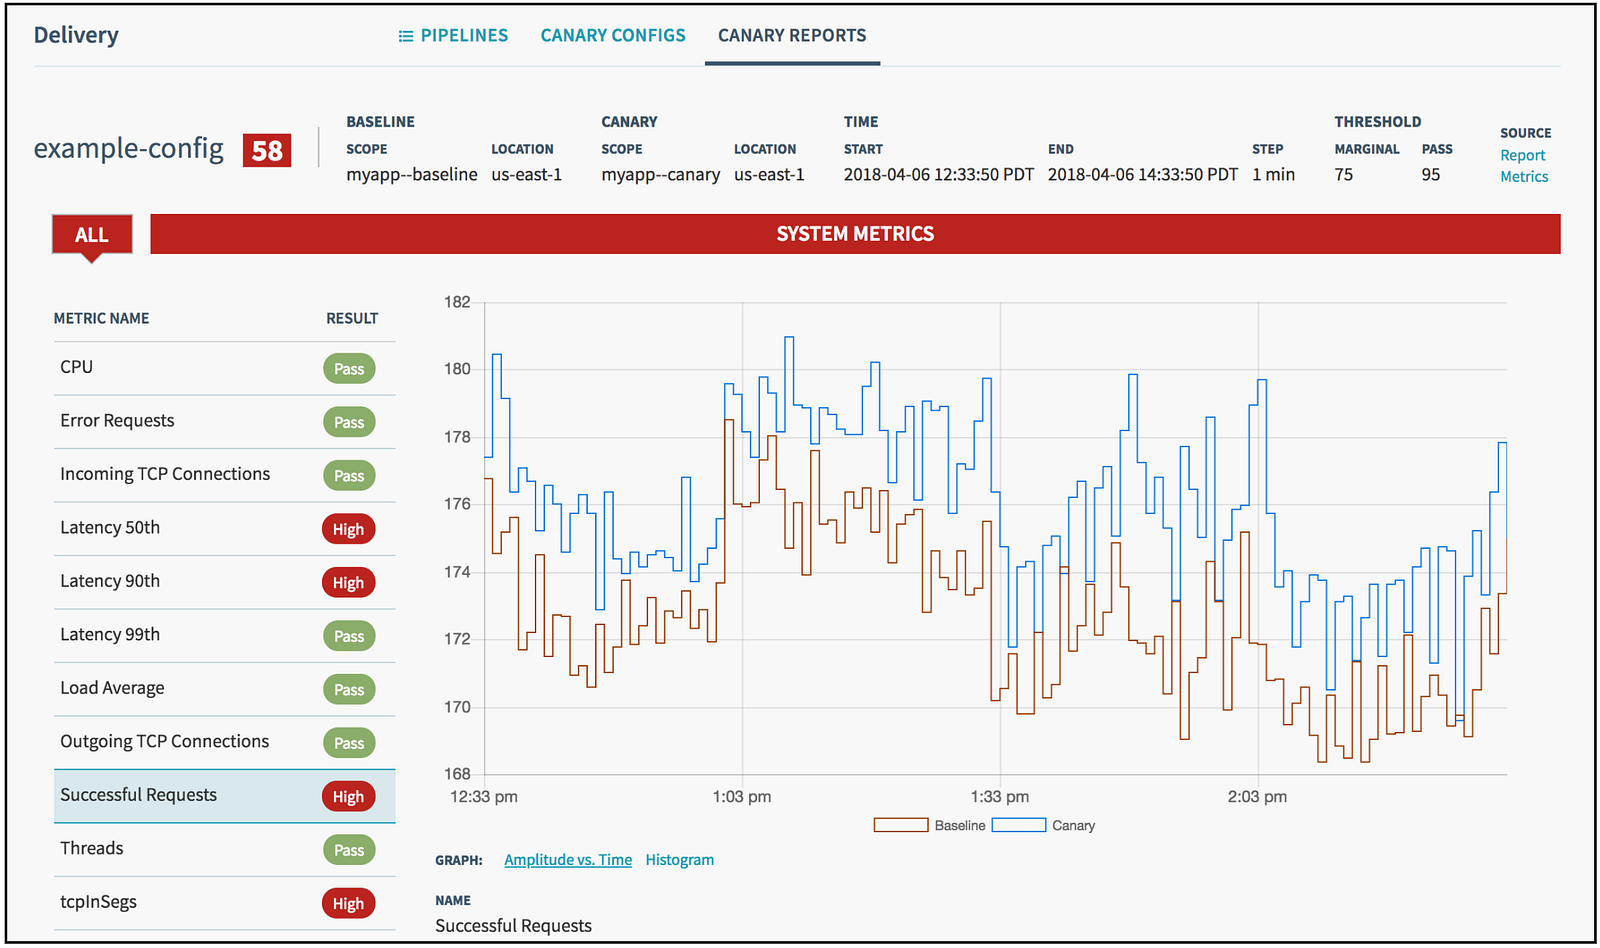
Users can drill down into the details of a canary result and view them in various ways using the Canary Report. The report gives a breakdown of the results by metric and displays the input data.
For example, the following report shows a canary score of 58%. A number of metrics were classified as “High” resulting in a lower score. By selecting a specific metric, users can get a view of the input data used for judgment. Having detailed insight into why a canary release failed is crucial in building confidence in the system.


Additional Features
Within Kayenta, the output of the metric retrieval and judgment stages is archived. This allows for new metric comparison algorithms and judges to be run on previously collected data leading to rapid experimentation.
In addition, metric sources, judges, configuration storage, and result storage are all pluggable. Kayenta is designed to allow new metric and judgment systems to be plugged in as needed.
A REST endpoint is provided to perform CRUD operations on configurations and retrieve canary results. This REST endpoint is used by Spinnaker pipelines to run an analysis, and is also available for use outside of Spinnaker. While we have heavily integrated with Spinnaker, Kayenta is able to run without any other Spinnaker components, having only Redis as a dependency.
Success at Netflix
Kayenta is much more flexible than our previous solution and is easier for application owners to configure. We have removed much of the complexity of setting proper thresholds and other hand-tuning, and instead rely on superior algorithms to classify whether a significant difference exists between the canary and baseline metrics.
Additionally, our legacy system had many special flags which were combined in various ways, but would later be unclear as to the intent of using them. Kayenta is more focused on semantic meaning of a metric, and will extend this further to set appropriate defaults for metrics such as “error” and “resource usage.”
We are in the middle of migrating from our legacy system to Kayenta. Currently, Kayenta runs approximately 30% of our production canary judgments, which amounts to an average of 200 judgments per day. Over the next few months, we plan on migrating all internal users to Kayenta
Learn More
The following are some ways you can learn more about Kayenta and contribute to the project:
