sklearn實戰:糖尿病預測(knn演算法)
阿新 • • 發佈:2019-01-01
%matplotlib inline
import matplotlib.pyplot as plt
import numpy as np
import pandas as pd
# 載入資料
data = pd.read_csv('datasets/pima-indians-diabetes/diabetes.csv')
print('dataset shape {}'.format(data.shape))
data.head()| Pregnancies | Glucose | BloodPressure | SkinThickness | Insulin | BMI | DiabetesPedigreeFunction | Age | Outcome | |
|---|---|---|---|---|---|---|---|---|---|
| 0 | 6 | 148 | 72 | 35 | 0 | 33.6 | 0.627 | 50 | 1 |
| 1 | 1 | 85 | 66 | 29 | 0 | 26.6 | 0.351 | 31 | 0 |
| 2 | 8 | 183 | 64 | 0 | 0 | 23.3 | 0.672 | 32 | 1 |
| 3 | 1 | 89 | 66 | 23 | 94 | 28.1 | 0.167 | 21 | 0 |
| 4 | 0 | 137 | 40 | 35 | 168 | 43.1 | 2.288 | 33 | 1 |
data.groupby("Outcome").size()Outcome
0 500
1 268
dtype: int64
X = data.iloc[:, 0:8]
Y = data.iloc[:, 8]
print('shape of X {}; shape of Y {}'.format(X.shape, Y.shape))
shape of X (768, 8); shape of Y (768,)
from sklearn.model_selection import train_test_split
X_train, X_test, Y_train, Y_test = train_test_split(X, Y, test_size=0.2);
from sklearn.neighbors import KNeighborsClassifier, RadiusNeighborsClassifier
models = []
models.append(("KNN", KNeighborsClassifier(n_neighbors=2)))
models.append(("KNN with weights", KNeighborsClassifier(
n_neighbors=2, weights="distance")))
models.append(("Radius Neighbors", RadiusNeighborsClassifier(
n_neighbors=2, radius=500.0)))results = []
for name, model in models:
model.fit(X_train, Y_train)
results.append((name, model.score(X_test, Y_test)))
for i in range(len(results)):
print("name: {}; score: {}".format(results[i][0],results[i][1]))name: KNN; score: 0.7077922077922078
name: KNN with weights; score: 0.6428571428571429
name: Radius Neighbors; score: 0.6753246753246753
from sklearn.model_selection import KFold
from sklearn.model_selection import cross_val_score

results = []
for name, model in models:
    kfold = KFold(n_splits=10)
    cv_result = cross_val_score(model, X, Y, cv=kfold)
    results.append((name, cv_result))
for i in range(len(results)):
    print("name: {}; cross val score: {}".format(
        results[i][0],results[i][1].mean()))
name: KNN; cross val score: 0.7147641831852358
name: KNN with weights; cross val score: 0.6770505809979495
name: Radius Neighbors; cross val score: 0.6497265892002735
模型訓練
knn = KNeighborsClassifier(n_neighbors=2)
knn.fit(X_train, Y_train)
train_score = knn.score(X_train, Y_train)
test_score = knn.score(X_test, Y_test)
print("train score: {}; test score: {}".format(train_score, test_score))
train score: 0.8501628664495114; test score: 0.7077922077922078
from sklearn.model_selection import ShuffleSplit
from common.utils import plot_learning_curve

knn = KNeighborsClassifier(n_neighbors=2)
cv = ShuffleSplit(n_splits=10, test_size=0.2, random_state=0)
plt.figure(figsize=(10, 6), dpi=200)
plot_learning_curve(plt, knn, "Learn Curve for KNN Diabetes",
                    X, Y, ylim=(0.0, 1.01), cv=cv);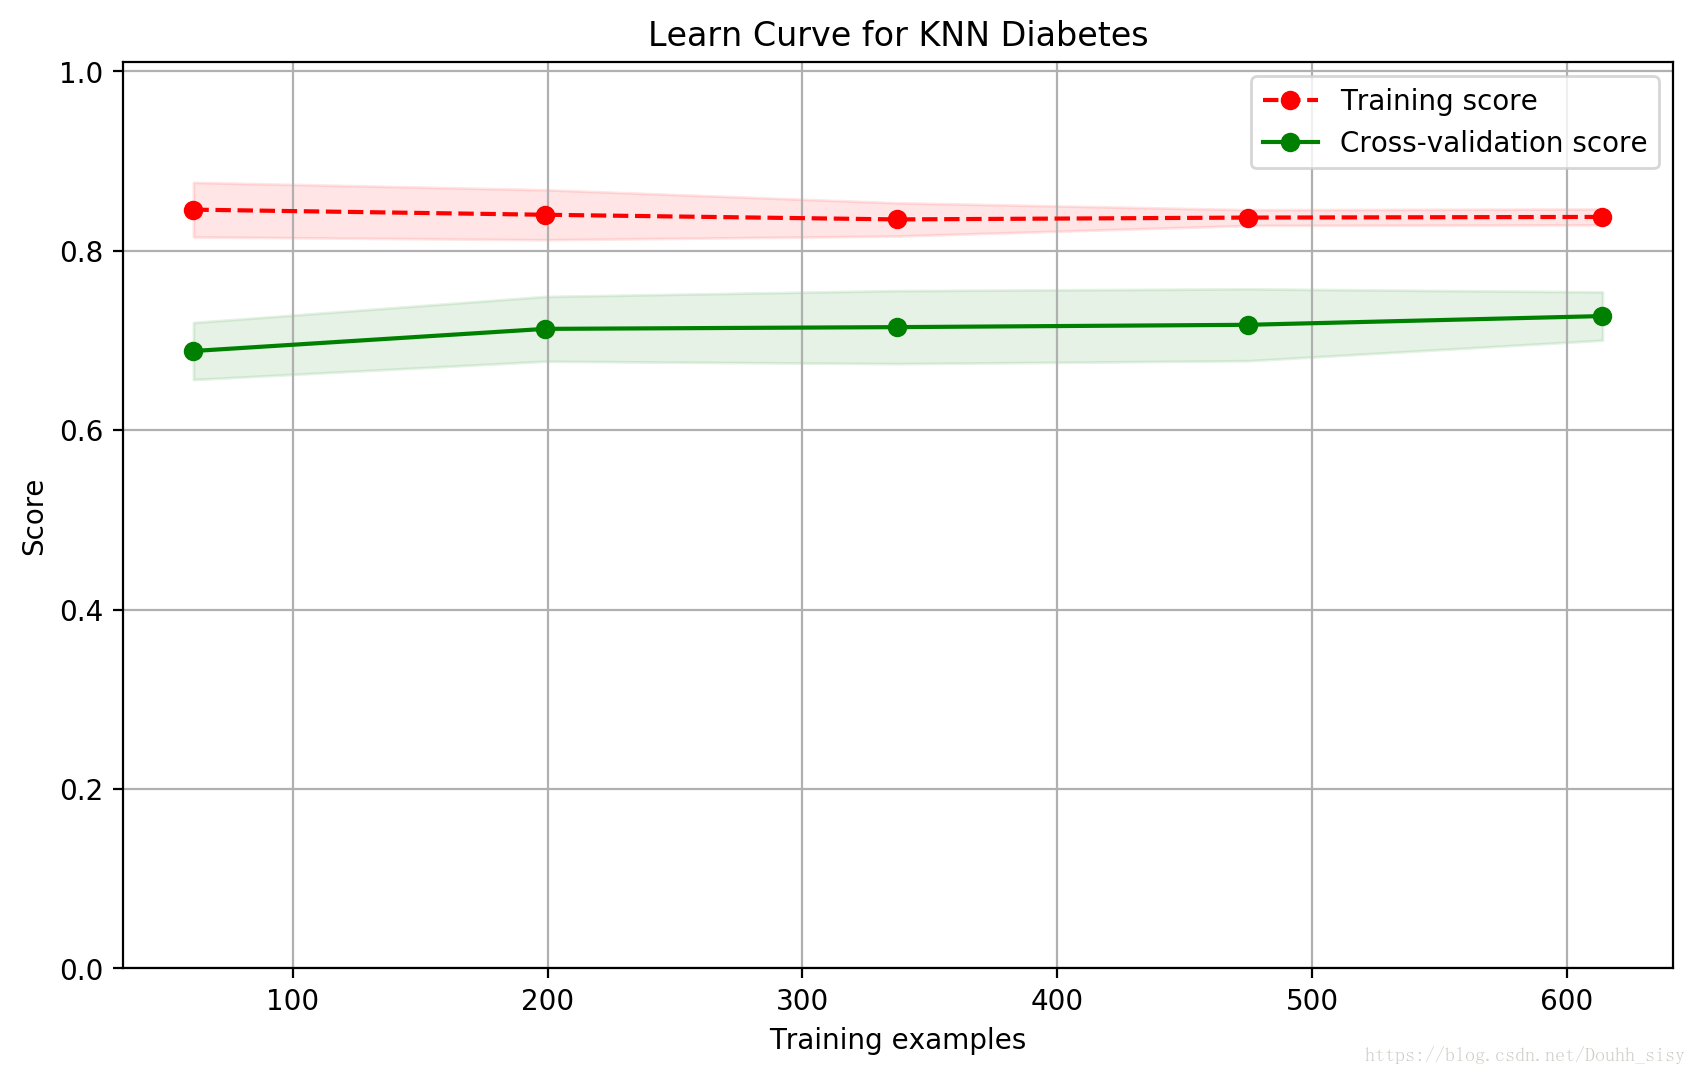
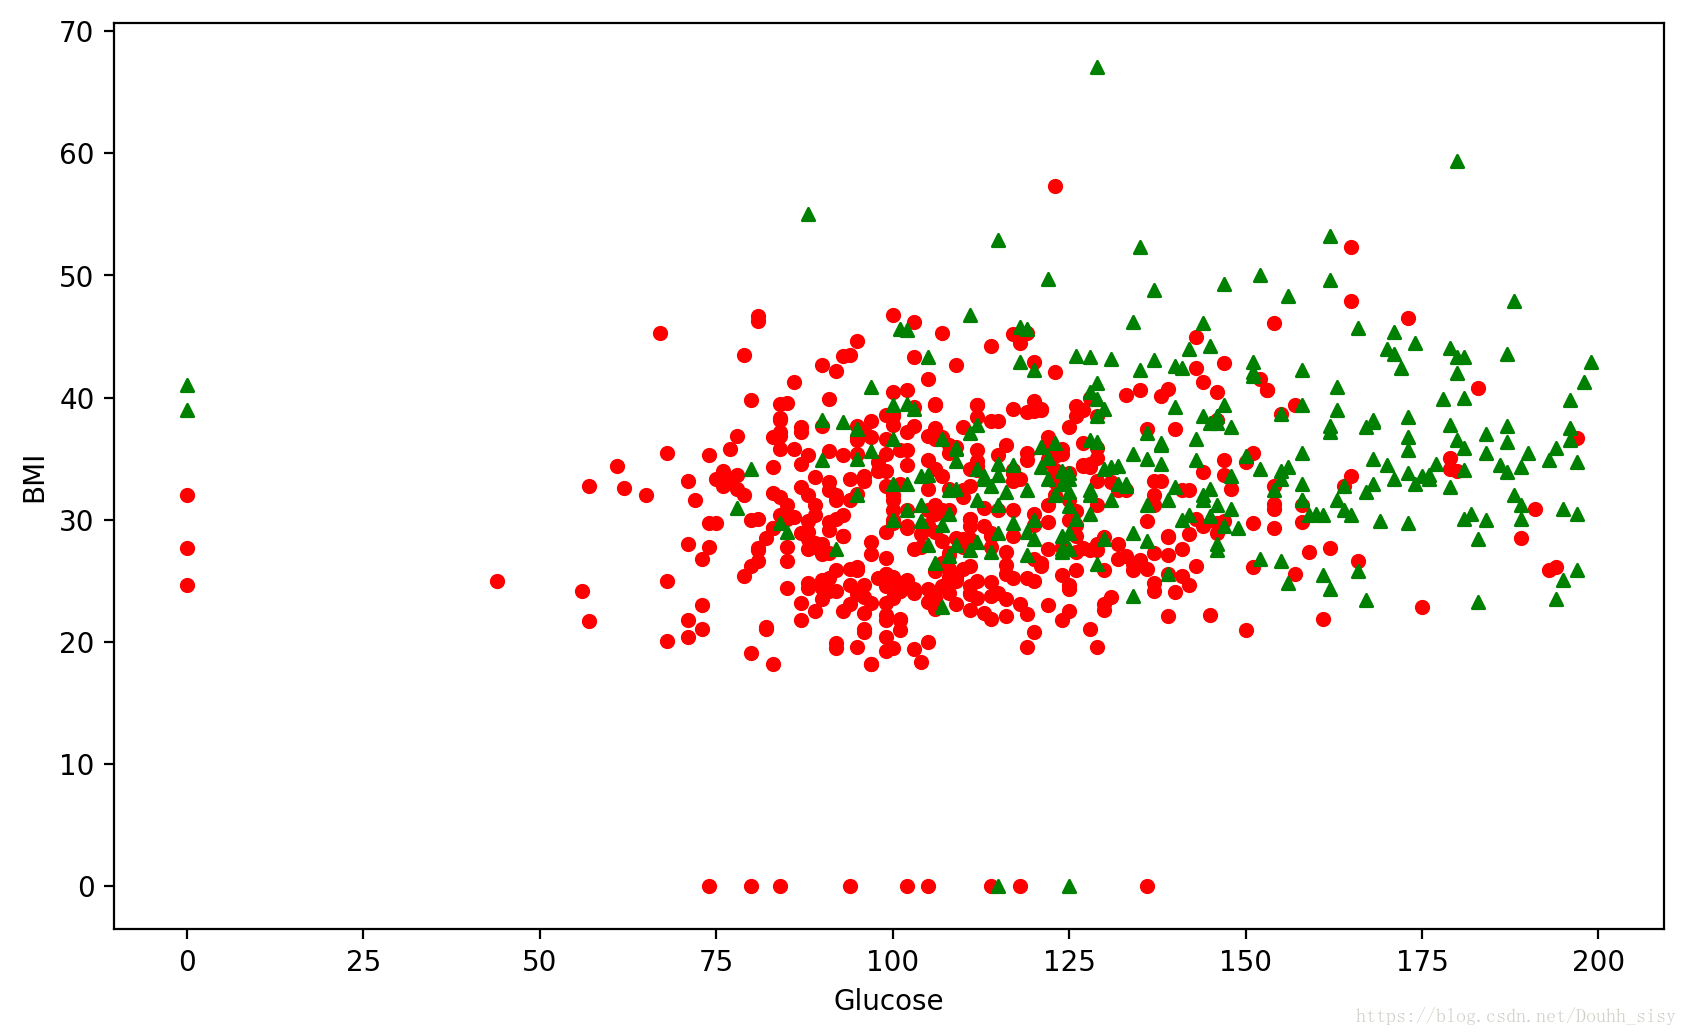
資料視覺化
from sklearn.feature_selection import SelectKBest

selector = SelectKBest(k=2)
X_new = selector.fit_transform(X, Y)
X_new[0:5]
array([[148. , 33.6],
[ 85. , 26.6],
[183. , 23.3],
[ 89. , 28.1],
[137. , 43.1]])
results = []
for name, model in models:
    kfold = KFold(n_splits=10)
    cv_result = cross_val_score(model, X_new, Y, cv=kfold)
    results.append((name, cv_result))
for i in range(len(results)):
    print("name: {}; cross val score: {}".format(
        results[i][0],results[i][1].mean()))
name: KNN; cross val score: 0.725205058099795
name: KNN with weights; cross val score: 0.6900375939849623
name: Radius Neighbors; cross val score: 0.6510252904989747
# 畫出資料
plt.figure(figsize=(10, 6), dpi=200)
plt.ylabel("BMI")
plt.xlabel("Glucose")
plt.scatter(X_new[Y==0][:, 0], X_new[Y==0][:, 1], c='r', s=20, marker='o');         # 畫出樣本
plt.scatter(X_new[Y==1][:, 0], X_new[Y==1][:, 1], c='g', s=20, marker='^');         # 畫出樣本