
《機器學習實戰2》
2017.2.28
第二章《k-近鄰演算法》
思維導圖:

1、基本演算法原理
簡單地說,k近鄰演算法採用測量不同特徵值之間的距離方法進行分類。
優點:精度高、對異常值不敏感、無資料輸入假定。
缺點:計算複雜度高、空間複雜度高。
適用資料範圍:數值型和標稱型。
工作原理:存在一個樣本資料集合,也稱作訓練樣本集,並且樣本集中每個資料都存在標籤,即我們知道樣本集中每一資料與所屬分類的對應關係。輸人沒有標籤的新資料後,將新資料的每個特徵與樣本集中資料對應的特徵進行比較,然後演算法提取樣本集中特徵最相似資料(最近鄰)的分類標籤。一般來說,我們只選擇樣本資料集中前k個最相似的資料,這就是k-近鄰演算法中k的出處,通常k是不大於20的整數。最後,選擇k個最相似資料中出現次數最多的分類,作為新資料的分類。
2、k-近鄰演算法的處理流程
(1)收集資料:可以使用任何方法。
(2)準備資料:距離計算所需要的數值,最好是結構化的資料格式。
(3)分析資料:可以使用任何方法。
(4)訓練演算法:此步驟不適用於k近鄰演算法。
(5)測試演算法:計算錯誤率。
(6)使用演算法:首先需要輸入樣本資料和結構化的輸出結果,然後執行女-近鄰演算法判定輸入資料分別屬於哪個分類,最後應用對計算出的分類執行後續的處理。
3、程式碼部分具體實現
(1)收集資料:
獲取每條資料的前三個特徵值構成了31000的矩陣,作為訓練樣本矩陣returnMat,每條資料的最後一個值儲存的是所屬分類的標籤,則這些值構成了11000的類標籤向量classLabelVector。
def file2matrix(filename):
fr = open(filename)
numberOfLines = len(fr.readlines()) #get the number of lines in the file
returnMat = zeros((numberOfLines,3)) #prepare matrix0 to return
classLabelVector = [] #prepare labels return
fr = open (2)準備資料:
我們通常採用的方法是將數值歸一化,如將取值範圍處理為0到1或者-1到1之間。下面的公式可以將任意取值範圍的特徵值轉化為0到1區間內的值:
newvalue = (oldvalue-min)/(max-min)
其中min和max分別是資料集中的最小特徵值和最大特徵值。雖然改變數值取值範圍增加了分類器的複雜度,但為了得到準確結果,我們必須這樣做。
def autoNorm(dataSet):
    minVals = dataSet.min(0)                    #尋找樣本中最小的值
    maxVals = dataSet.max(0)                    #尋找樣本中最大的值
    ranges = maxVals - minVals
    normDataSet = zeros(shape(dataSet))         #建立和樣本集一樣大的0矩陣
    m = dataSet.shape[0]                        #建立一維陣列
    normDataSet = dataSet - tile(minVals, (m,1))    #樣本中的元素和最小值之間的差值
    normDataSet = normDataSet/tile(ranges, (m,1))   #歸一化後的樣本集
    return normDataSet, ranges, minVals
(3)分析資料:
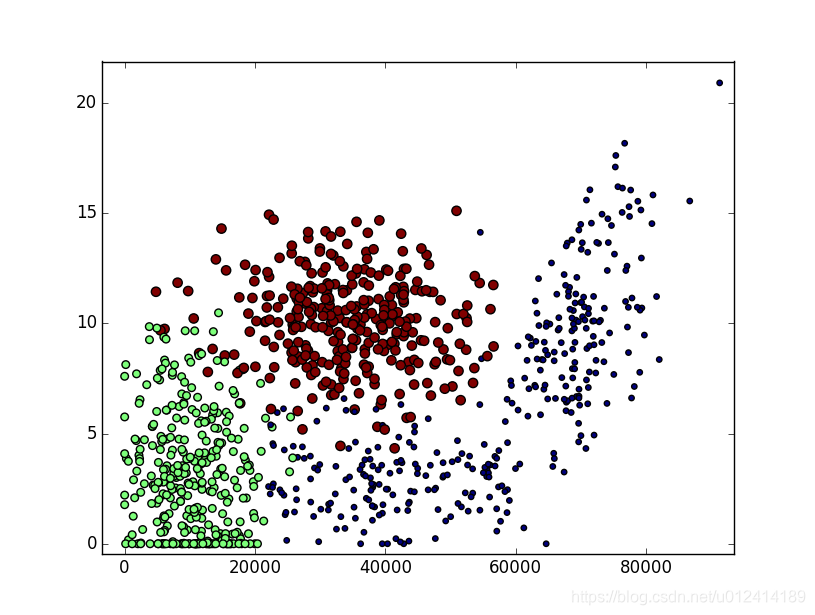
我們需要了解資料的真實含義。當然我們可以直接瀏覽文字檔案,但是這種方法非常不友好,一般來說,我們會採用圖形化的方式直觀地展示資料。下面就用?^1!(瓜工具來圖形化展示資料內容,以便辨識出一些資料模式。使用Matplotlib建立散點圖k可以清楚明白的看到分類的必要。
輸入一下畫圖程式碼:
import numpy
import matplotlib
import matplotlib.pyplot as plt
import kNN
reload(kNN)
datingDataMat,datingLabels=kNN.file2matrix('datingTestSet2.txt')
fig = plt.figure()
ax = fig.add_subplot(111)
ax.scatter(datingDataMat[:,1],datingDataMat[:,2],15.0*numpy.array(datingLabels),15.0*numpy.array(datingLabels))
plt.show()
下面使用後兩個特徵的圖片
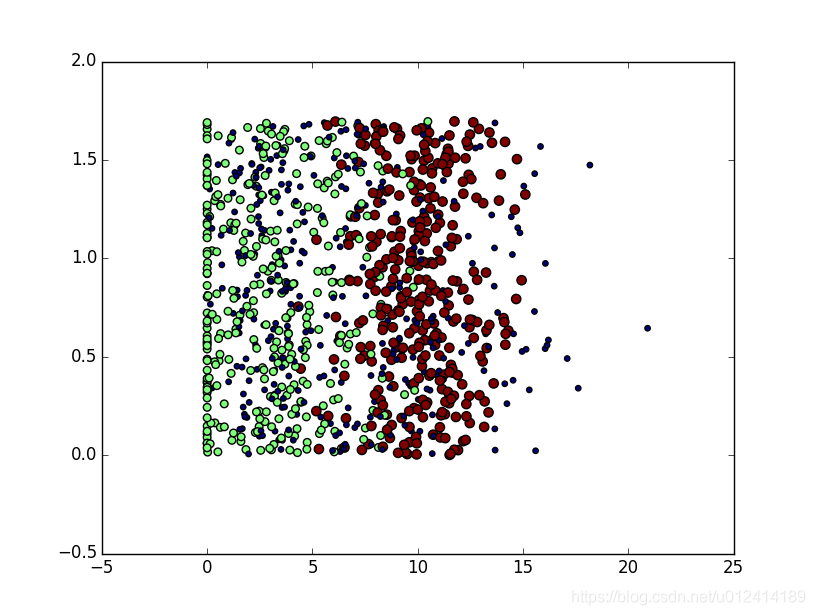
將scatter函式修改為:
ax.scatter(datingDataMat[:,0],datingDataMat[:,1],15.0*numpy.array(datingLabels),15.0*numpy.array(datingLabels))
使用前兩個特徵的圖片
(4)分類演算法:
就是使用距離公式計算特徵值之間的距離,選擇最鄰近的k個點,通過統計這k個點的結果來得出樣本的預測值。首先給出這種分類演算法。
def classify0(inX, dataSet, labels, k):
    dataSetSize = dataSet.shape[0]        #從樣本集中取出資料
    diffMat = tile(inX, (dataSetSize,1)) - dataSet  #求出所有樣本集和輸入值之間的差值
    sqDiffMat = diffMat**2                #算差值的平方
    sqDistances = sqDiffMat.sum(axis=1)   #計算求和,axis=1表示按行相加 , axis=0表示按列相加
    distances = sqDistances**0.5          #開方
    sortedDistIndicies = distances.argsort()   #返回陣列值的從小到大的索引值
    classCount={}
    for i in range(k):
        voteIlabel = labels[sortedDistIndicies[i]]   #選出距離小於k的label值
        classCount[voteIlabel] = classCount.get(voteIlabel,0) + 1    #建立一個字典,存放的是label值出現的次數count
    sortedClassCount = sorted(classCount.items(), key=operator.itemgetter(1), reverse=True)  #對字典遍歷,按照count的順序,從大到小排序
    return sortedClassCount[0][0]    #返回第一個就是頻率最高的那個
(5)測試演算法:作為完整程式驗證分類器
機器學習演算法的一個很重要的工作就是評估演算法的正確率,通常我們只提供已有資料的90%作為訓練樣本,而使用其餘的10%資料去測試分類器,檢測分類器的正確率。需要注意的是,這10%的測試資料應該是隨機選擇的,下面我們在kNN.py中建立函式datingClassTest()來測試分類器效果,獲取錯誤率。
datingClassTest()程式碼如下:
def datingClassTest():
    hoRatio = 0.10      #hold out 10%           #預留10%作為測試樣本
    datingDataMat,datingLabels = file2matrix(r'C:\Users\lz\Desktop\2017_2_28\datingTestSet2.txt')      #load data setfrom file
    normMat, ranges, minVals = autoNorm(datingDataMat)                  #歸一化資料
    m = normMat.shape[0]                                                #計算樣本集的行數
    numTestVecs = int(m*hoRatio)                                        #給出測試機的行數
    errorCount = 0.0                                                    #錯誤判斷計數
    for i in range(numTestVecs):
        classifierResult = classify0(normMat[i,:],normMat[numTestVecs:m,:],datingLabels[numTestVecs:m],3)     #呼叫k分類器
        print("the classifier came back with: %d, the real answer is: %d" % (classifierResult, datingLabels[i]))   #列印測試集的結果
        if (classifierResult != datingLabels[i]): errorCount += 1.0

    print ("the total error rate is: %f" % (errorCount/float(numTestVecs)) )                  #輸出錯誤總數
    print (errorCount)
程式碼中用datingTestSet2.txt中的10%的資料作為測試樣本,50%的資料作為訓練樣本,將推測結果和實際結果進行比較,獲取錯誤率,以下為測試結果:
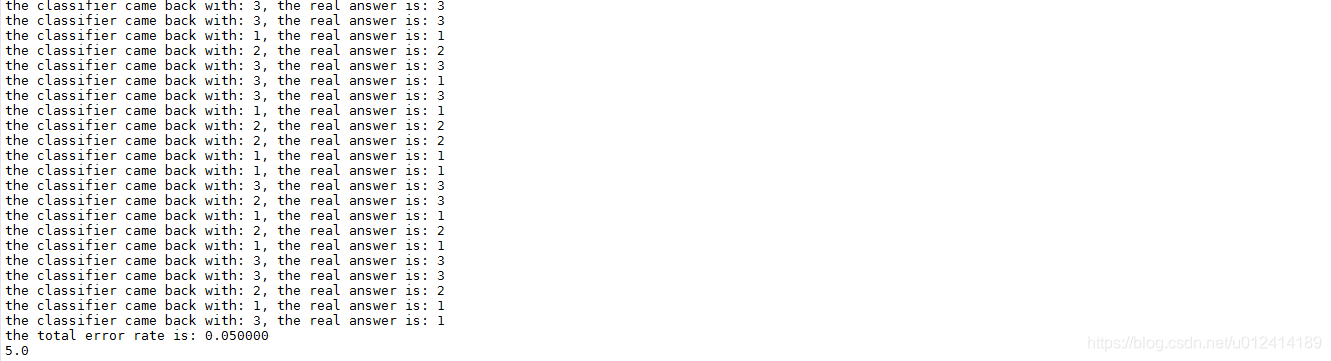
錯誤率為5%,我們可以通過對訓練樣本和測試樣本的調整,改變精度,也可以通過對k值的調整,改變精度。
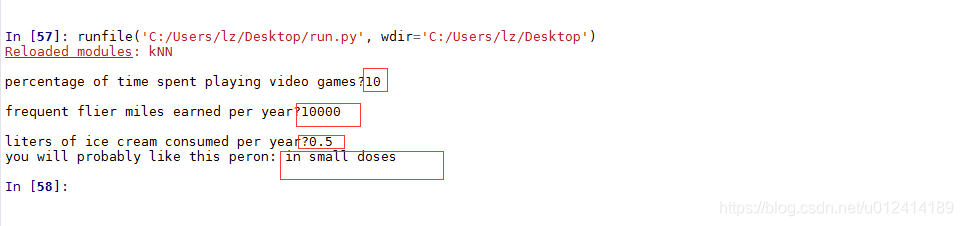
(6)使用演算法:完善系統
kNN.py中加入函式classifyPerson():
def classifyPerson():
    resultList = ['not at all', 'in small doses', 'in large doses']
    percentTats = float(input("percentage of time spent playing video games?"))
    ffMiles = float(input("frequent flier miles earned per year?"))
    iceCream = float(input("liters of ice cream consumed per year?"))
    datingDataMat, datingLabels = file2matrix(r'C:\Users\lz\Desktop\2017_2_28\datingTestSet2.txt')
    normMat, ranges, minVals = autoNorm(datingDataMat)
    inArr = array([ffMiles, percentTats, iceCream])
    classifierResult = classify0((inArr - minVals) / ranges, normMat, datingLabels, 3)
    print ("you will probably like this peron:", resultList[classifierResult - 1])
使用這個分類測試結果:
3、參考部落格
http://blog.csdn.net/du_wood/article/details/52204850
http://blog.csdn.net/iboxty/article/details/44982013
http://blog.csdn.net/memray/article/details/17646197
4、原始碼
# -*- coding: utf-8 -*-
"""
Created on Mon Feb 27 20:23:01 2017
@author: lz
"""
from numpy import *
import operator
from os import listdir

def classify0(inX, dataSet, labels, k):
   dataSetSize = dataSet.shape[0]        #從樣本集中取出資料
   diffMat = tile(inX, (dataSetSize,1)) - dataSet  #求出所有樣本集和輸入值之間的差值
   sqDiffMat = diffMat**2                #算差值的平方
   sqDistances = sqDiffMat.sum(axis=1)   #計算求和,axis=1表示按行相加 , axis=0表示按列相加
   distances = sqDistances**0.5          #開方
   sortedDistIndicies = distances.argsort()   #返回陣列值的從小到大的索引值
   classCount={}
   for i in range(k):
       voteIlabel = labels[sortedDistIndicies[i]]   #選出距離小於k的label值
       classCount[voteIlabel] = classCount.get(voteIlabel,0) + 1    #建立一個字典,存放的是label值出現的次數count
   sortedClassCount = sorted(classCount.items(), key=operator.itemgetter(1), reverse=True)  #對字典遍歷,按照count的順序,從大到小排序
   return sortedClassCount[0][0]    #返回第一個就是頻率最高的那個

def createDataSet():
   group = array([[1.0,1.1],[1.0,1.0],[0,0],[0,0.1]])
   labels = ['A','A','B','B']
   return group, labels


def file2matrix(filename):
   fr = open(filename)
   numberOfLines = len(fr.readlines())         #get the number of lines in the file
   returnMat = zeros((numberOfLines,3))        #prepare matrix0 to return
   classLabelVector = []                       #prepare labels return
   fr = open(filename)
   index = 0
   for line in fr.readlines():
       line = line.strip()                     #去掉字串頭尾的空格
       listFromLine = line.split('\t')         #以空格作為分隔符,分隔每一行的字串
       returnMat[index,:] = listFromLine[0:3]  #將分隔的字串前三個賦值給之前建立的0矩陣
       classLabelVector.append(int(listFromLine[-1]))  #在labels矩陣末尾新增分隔的第4個字串
       index += 1
   return returnMat,classLabelVector           #返回兩個矩陣,分別是樣本訓練集和標籤向量


def autoNorm(dataSet):
   minVals = dataSet.min(0)                    #尋找樣本中最小的值
   maxVals = dataSet.max(0)                    #尋找樣本中最大的值
   ranges = maxVals - minVals
   normDataSet = zeros(shape(dataSet))         #建立和樣本集一樣大的0矩陣
   m = dataSet.shape[0]                        #建立一維陣列
   normDataSet = dataSet - tile(minVals, (m,1))    #樣本中的元素和最小值之間的差值
   normDataSet = normDataSet/tile(ranges, (m,1))   #歸一化後的樣本集
   return normDataSet, ranges, minVals


def datingClassTest():
   hoRatio = 0.10      #hold out 10%           #預留10%作為測試樣本
   datingDataMat,datingLabels = file2matrix(r'C:\Users\lz\Desktop\2017_2_28\datingTestSet2.txt')      #load data setfrom file
   normMat, ranges, minVals = autoNorm(datingDataMat)                  #歸一化資料
   m = normMat.shape[0]                                                #計算樣本集的行數
   numTestVecs = int(m*hoRatio)                                        #給出測試機的行數
   errorCount = 0.0                                                    #錯誤判斷計數
   for i in range(numTestVecs):
       classifierResult = classify0(normMat[i,:],normMat[numTestVecs:m,:],datingLabels[numTestVecs:m],3)     #呼叫k分類器
       print("the classifier came back with: %d, the real answer is: %d" % (classifierResult, datingLabels[i]))   #列印測試集的結果
       if (classifierResult != datingLabels[i]): errorCount += 1.0

   print ("the total error rate is: %f" % (errorCount/float(numTestVecs)) )                  #輸出錯誤總數
   print (errorCount)

def classifyPerson():
   resultList = ['not at all', 'in small doses', 'in large doses']
   percentTats = float(input("percentage of time spent playing video games?"))
   ffMiles = float(input("frequent flier miles earned per year?"))
   iceCream = float(input("liters of ice cream consumed per year?"))
   datingDataMat, datingLabels = file2matrix(r'C:\Users\lz\Desktop\2017_2_28\datingTestSet2.txt')
   normMat, ranges, minVals = autoNorm(datingDataMat)
   inArr = array([ffMiles, percentTats, iceCream])
   classifierResult = classify0((inArr - minVals) / ranges, normMat, datingLabels, 3)
   print ("you will probably like this peron:", resultList[classifierResult - 1])
plot_datingTestSet.py
# -*- coding: utf-8 -*-
"""
Created on Tue Feb 28 11:26:03 2017

@author: lz
"""

import numpy
import matplotlib
import matplotlib.pyplot as plt
import kNN
reload(kNN)
datingDataMat,datingLabels=kNN.file2matrix(r'C:\Users\lz\Desktop\2017_2_28\datingTestSet2.txt')
fig = plt.figure()
ax = fig.add_subplot(111)
ax.scatter(datingDataMat[:,0],datingDataMat[:,1],15.0*numpy.array(datingLabels),15.0*numpy.array(datingLabels))
plt.show()
run.py
# -*- coding: utf-8 -*-
"""
Created on Tue Feb 28 11:26:03 2017

@author: lz
"""

import sys
sys.path.append(r'C:\Users\lz\Desktop\2017_2_28')
import kNN
reload (kNN)
#group,labels = kNN.createDataSet()
#kNN.datingClassTest()
kNN.classifyPerson()
利用Knn近鄰演算法識別手寫字型
背景:利用k-近鄰演算法構造可以識別數字0到9的系統,需要處理的數字已經使用圖形處理軟體,處理成32*32畫素的黑白影象,為了方便理解,資料以文字檔案儲存(雖然這不是一個好辦法),資料格式如下:
00000000000001100000000000000000
00000000000011111100000000000000
00000000000111111111000000000000
00000000011111111111000000000000
00000001111111111111100000000000
00000000111111100011110000000000
00000001111110000001110000000000
00000001111110000001110000000000
00000011111100000001110000000000
00000011111100000001111000000000
00000011111100000000011100000000
00000011111100000000011100000000
00000011111000000000001110000000
00000011111000000000001110000000
00000001111100000000000111000000
00000001111100000000000111000000
00000001111100000000000111000000
00000011111000000000000111000000
00000011111000000000000111000000
00000000111100000000000011100000
00000000111100000000000111100000
00000000111100000000000111100000
00000000111100000000001111100000
00000000011110000000000111110000
00000000011111000000001111100000
00000000011111000000011111100000
00000000011111000000111111000000
00000000011111100011111111000000
00000000000111111111111110000000
00000000000111111111111100000000
00000000000011111111110000000000
00000000000000111110000000000000
以上為數字‘0’的一個訓練樣本。
步驟:
● 收集資料:提供文字檔案。
● 準備資料:編寫函式classify0(),將資料轉換為分類器使用的list格式。
● 分析資料:在python命令中檢查資料,確保它符合要求。
● 訓練演算法:此步驟不適用於k-近鄰演算法。
● 測試演算法:編寫函式,以部分樣本作為測試樣本,計算精度。
● 使用演算法:構建完整的應用程式。
準備資料:將影象轉換為測試向量
目錄trainingDigits中包含了大約2000個例子,每個數字大約有200個樣本,目錄testDigits中包含大約900個測試資料。我們使用目錄trainingDigits中的資料訓練分類器,使用目錄testDigits中的資料測試分類器的效果。
首先我們在上節的kNN模組中新增函式img2vector(),將影象轉換為向量:該函式建立11024的numpy陣列,然後開啟檔案,迴圈讀出檔案的前32行,將每行的前32個字元儲存在numpy陣列中,將3232的矩陣轉換為1*1024的向量:
程式碼如下:
 def img2vector(filename):                                         #建立一個1*1024的陣列
    returnVect = zeros((1,1024))
    fr = open(filename)
    for i in range(32):                                           #每32行的資料迴圈讀出來
        lineStr = fr.readline()
        for j in range(32):
            returnVect[0,32*i+j] = int(lineStr[j])                #把每32行的資料讀出來放置在建立的1*1024的陣列中
    return returnVect
測試演算法:使用k-近鄰演算法識別手寫數字
kNN模組中建立handwritingClassTest()函式:
def handwritingClassTest():
    hwLabels = []
    trainingFileList = listdir('tra