隨機梯度下降演算法的Python實現
當用於訓練的資料量非常大時,批量梯度下降演算法變得不再適用(此時其速度會非常慢),為解決這個問題,人們又想出了隨機梯度下降演算法。隨機梯度下降演算法的核心思想並沒有變,它仍是基於梯度,通過對目標函式中的引數不斷迭代更新,使得目標函式逐漸靠近最小值。
具體程式碼實現如下:
先匯入要用到的各種包:
%matplotlib notebook
import pandas as pd
import matplotlib.pyplot as plt
import numpy as np
讀入資料並檢視資料的相關資訊:
data = pd.read_csv('ex1data1.txt',header = None,names=['Population','Profits'])
data.head() # 檢視data中的前五條資料
data中前五條資料如下圖所示:
data.describe() # 檢視data的各描述統計量資訊如下圖所示:
繪製原始資料的散點圖:
fig,axes = plt.subplots()
data.plot(kind='scatter',x='Population',y='Profits',ax=axes,marker='o',color='r')
axes.set(xlabel='Population',ylabel='Profits')
fig.savefig('p1.png')
繪製的散點圖為:

向data中新增一列便於矩陣計算的輔助列:
data.insert(0,'Ones',1)
data.head()
加入輔助列的data如下所示:
隨機梯度下降的實現:
# 定義資料特徵和標籤的提取函式:
def get_fea_lab(data):
    cols = data.shape[1]
    X = data.iloc[:,0:cols-1] # X是data中的前兩列(不包括索引列)
    y = data.iloc[:,cols-1:cols] # y是data中的最後一列

    # 將X和y都轉化成矩陣的形式:
    X = np.matrix(X.values)
    y = np.matrix(y.values)
    return X,y

# 定義代價函式:
def computeCost(data,theta,i):
    X,y = get_fea_lab(data)
    inner = np.power(((X*theta.T)-y),2)
    return (float(inner[i]/2))

# 定義隨機梯度下降函式:
def stochastic_gradient_descent(data,theta,alpha,epoch):

    X0,y0 = get_fea_lab(data)  # 提取X和y矩陣
    temp = np.matrix(np.zeros(theta.shape))
    parameters = int(theta.shape[1])
    cost = np.zeros(len(X0))
    avg_cost = np.zeros(epoch)

    for k in range(epoch):
        new_data = data.sample(frac=1) # 打亂資料
        X,y = get_fea_lab(new_data)  # 提取新的X和y矩陣

        for i in range(len(X)):
            error = X[i:i+1]*theta.T-y[i]
            cost[i] = computeCost(new_data,theta,i)

            for j in range(parameters):
                temp[0,j] = theta[0,j] - alpha*error*X[i:i+1,j]

            theta = temp
        avg_cost[k] = np.average(cost)

    return theta,avg_cost

# 初始化學習率、迭代輪次和引數theta:
alpha = 0.001
epoch = 200
theta = np.matrix(np.array([0,0]))

# 呼叫隨機梯度下降函式來計算線性迴歸中的theat引數:
g,avg_cost = stochastic_gradient_descent(data,theta,alpha,epoch)

# g的值為matrix([[-3.77650181,  1.29548466]])
繪製每輪迭代中代價函式的平均值與迭代輪次的關係影象:
本例中因為資料集中一共只有97個樣本,所以對於每輪迭代,我選擇的是計算所有樣本對應的的代價函式的平均值。在資料集非常大的情況下,我們可以選擇計算每輪迭代中最後一部分樣本對應的代價函式的平均值。
fig, axes = plt.subplots()
axes.plot(np.arange(epoch), avg_cost, 'r')
axes.set_xlabel('Epoch')
axes.set_ylabel('avg_cost')
axes.set_title('avg_cost vs. Epoch')
fig.savefig('p2.png')
具體如下圖所示:

從上圖中我們可以看到,大約從第90輪迭代開始,代價函式的平均值在某個值上下進行小範圍波動(某個值其實就是值全域性最小值)。前面,我們把最大迭代輪次設為了200,並據此計算除了線性迴歸引數theta的值為matrix([[-3.77650181, 1.29548466]])。而用正規方程計算出的theta引數的精確值為matrix([[-3.89578088],[ 1.19303364]]),二者的差別在可接受範圍內。關於用正規方程求解線性迴歸引數可以參考:https://blog.csdn.net/qq_41080850/article/details/85292769、https://blog.csdn.net/qq_41080850/article/details/85159645。
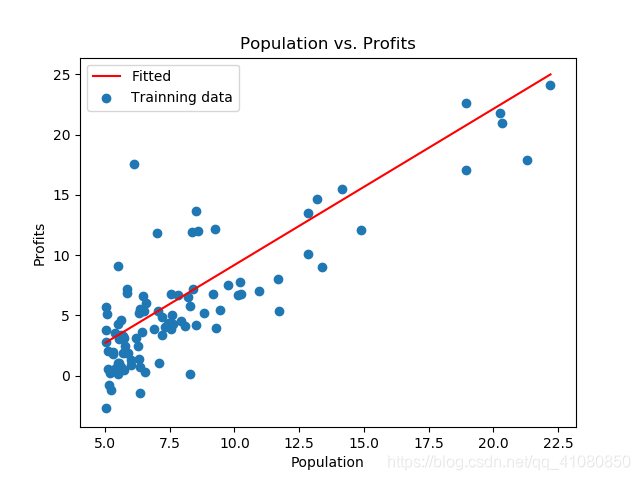
根據前文計算出的theta引數值,繪製原始資料的線性擬合圖:
x = np.linspace(data.Population.min(),data.Population.max(),100)
f = g[0,0] + g[0,1]*x

fig,axes = plt.subplots()
axes.plot(x,f,'r',label='Fitted')
axes.scatter(x=data.Population,y=data.Profits,label='Trainning data')
axes.legend(loc='best')
axes.set(xlabel='Population',ylabel='Profits',title='Population vs. Profits')
fig.savefig('p3.png')
繪製的線性擬合圖為:

批量梯度下降演算法與隨機梯度下降演算法的比較:
1)批量梯度下降演算法在每次迭代更新目標函式的引數時,是將訓練資料集中的所有樣本都考慮進去,以此計算代價函式;而隨機梯度下降演算法在每次迭代更新目標函式的引數時,只考慮資料集中的一個樣本並據此計算代價函式。因此,當訓練資料集非常大時,隨機梯度下降的迭代速度要比批量梯度下降的迭代速度快很多。
兩者的代價函式具體如下圖所示:
上圖中,左邊是批量梯度下降的代價函式,右邊是隨機梯度下降的代價函式。
2)不同於批量梯度下降,當迭代到一定輪次時,隨機梯度下降計算出的代價函式是在某個靠近全域性最小值的區域內徘徊,而不是直接逼近全域性最小值並停留在那點。關於隨機梯度下降的收斂性,可以參考:https://www.zhihu.com/question/27012077。
其他參考資料:
《Python Machine Learning Second Edition》——Vahid Mirjalili&Sebastian Raschka
Andew Ng機器學習公開課
https://blog.csdn.net/qq_22238533/article/details/70917102
PS:本文為博主原創文章,轉載請註明出處。


