多元線性迴歸分析練習題
阿新 • • 發佈:2018-12-20
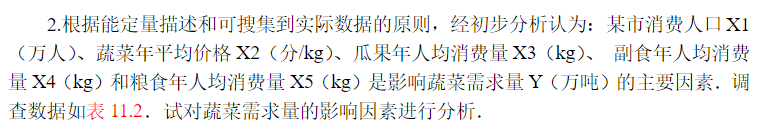
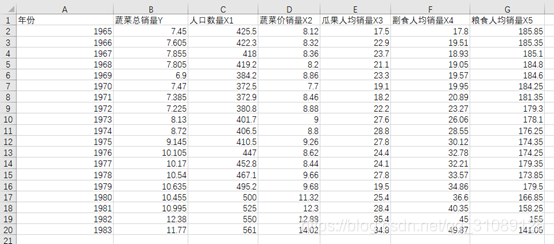
表 11.2 資料
python程式碼
import pandas as pd
import statsmodels.api as sm
ex922 = pd.read_csv('D:ex922.csv',encoding='gbk')
values = ['人口數量X1','蔬菜價銷量X2','瓜果人均銷量X3','副食人均銷量X4','糧食人均銷量X5']
factors = ['X1','X2','X3','X4','X5']
def Morelinear(value,name):
    X=ex922[value]
    X=sm.add_constant(X)
    y = ex922[name]
    est=sm.OLS(y,X).fit()
return est

def Delsomefactor():   #刪除不顯著的因素
    result = Morelinear(values,'蔬菜總銷量Y')
    results = result.pvalues.tolist()
    for i in range(1,len(results)):
        if(results[i]<0.05):
            break;
    while(result.fvalue > result.f_pvalue):
        c=[] #放位置
        cc=[] #放值
        for i in range(1,len(result.pvalues)):
            if(result.pvalues[i]>0.05):   #選出影響不顯著的因素
                cc.append(result.pvalues[i])
                c.append(i)
        if(len(cc)==0):
            break
        else:
            maxvalue = max(cc)    #挑出最不顯著的值
            index = cc.index(maxvalue)
            indexvalue = c[index] -1 #找出其位置
            del(values[indexvalue])

            del(factors[indexvalue])
            result = Morelinear (values,'蔬菜總銷量Y')
            results = result.pvalues.tolist()
return result

def Linermodel():  #構造迴歸模型
    finalresult = Delsomefactor()
    finalresult.params.index[1:]
    l=len(finalresult.params)
    print('Y=',end='')
    for i in range(l):
        if(i == 0):
            print(finalresult.params[i], end='+')

        elif(i!=l-1):
            if(finalresult.params[i+1]>0):
                print(finalresult.params[i],'*',factors[i-1], end='+')
            else:
                 print(finalresult.params[i],'*',factors[i-1],end='')
        elif(i== (l-1)):
            print(finalresult.params[i],'*',factors[i-1])
    return finalresult
執行
fres = Linermodel()
得出結果
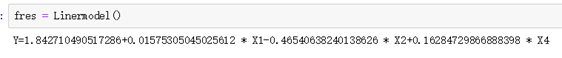
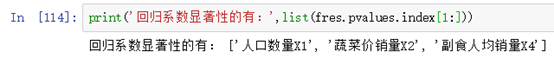
查看回歸係數顯著的因素
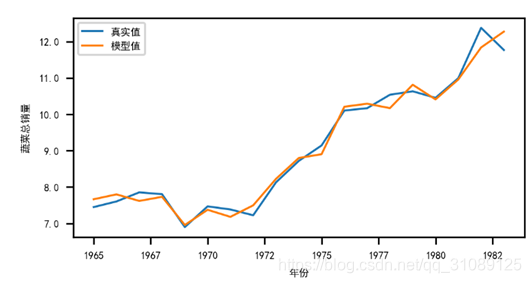
擬合效果圖
import numpy as np
import matplotlib.pyplot as plt
import matplotlib
import pylab as mpl
import pandas as pd
# 解決視覺化不能顯示中文和符號問題:
matplotlib.rcParams['font.sans-serif'] = ['SimHei']
matplotlib.rcParams['font.family'] = 'sans-serif'
matplotlib.rcParams['axes.unicode_minus'] = False
plt.rcParams.update(params)
plt.rcParams['savefig.dpi'] = 10 #圖片畫素
plt.rcParams['figure.dpi'] = 300 #解析度
from matplotlib.ticker import MultipleLocator, FormatStrFormatter
xmajorLocator   = MultipleLocator(2) #將x主刻度標籤設定為20的倍數
import matplotlib.ticker as ticker
Y1=ex922['蔬菜總銷量Y']
X=ex922['年份']
X1=ex922['人口數量X1']
X2=ex922['蔬菜價銷量X2']
X4=ex922['副食人均銷量X4']
Y2=1.842710490517286+0.01575305045025612 * X1-0.46540638240138626 * X2+0.16284729866888398 * X4

X=X.tolist()
plt.plot(X,Y,label="真實值")
plt.plot(X,Y2,label="模型值")
plt.xlabel("年份")
plt.ylabel("蔬菜總銷量")
plt.gca().xaxis.set_major_formatter(ticker.FormatStrFormatter('%d'))  #x軸取整數
plt.gca().yaxis.set_major_formatter(ticker.FormatStrFormatter('%1.1f'))  #x軸取整數
plt.legend(loc='best')
plt.show()