
R語言開發之二項分佈瞭解下
阿新 • • 發佈:2019-02-02
二項分佈模型用來處理在一系列實驗中只發現兩個可能結果的事件的成功概率,例如,擲硬幣總是兩種結果:正面或反面。我們可以使用二項式分佈估算在重複拋擲硬幣10次時正好準確地找到3次是正面的概率。在R中具有四個內建函式來生成二項分佈,如下:
dbinom(x, size, prob)
pbinom(x, size, prob)
qbinom(p, size, prob)
rbinom(n, size, prob)
引數描述如下:
- x - 是數字的向量。
- p - 是概率向量。
- n - 是觀察次數。
- size - 是試驗的次數。
- prob - 是每次試驗成功的概率。
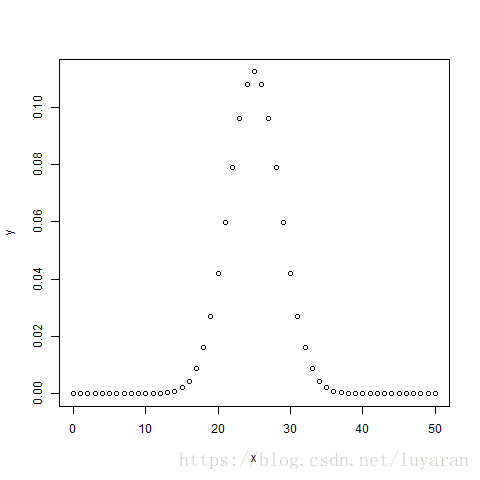
dbinom函式給出了每個點的概率密度分佈,案例如下:
setwd("D:/r_file")
# Create a sample of 50 numbers which are incremented by 1.
x <- seq(0,50,by = 1)

# Create the binomial distribution.
y <- dbinom(x,50,0.5)

# Give the chart file a name.
png(file = "dbinom.png")

# Plot the graph for this sample.
plot(x,y)

# Save the file.
dev.off()
輸出如下:
pbinom函式給出事件的累積概率,它用於表示概率的單個值,案例如下:
setwd("D:/r_file")
# Probability of getting 26 or less heads from a 51 tosses of a coin.
x <- pbinom(26,51,0.5)

print(x)
結果如下:
[1] 0.610116qbinom函式採用概率值,並給出其累積值與概率值匹配的數字,案例如下:
setwd("D:/r_file")
# How many heads will have a probability of 0.25 will come out when a coin is tossed 51 times.
x <- qbinom(0.25,51,1/2)

print(x)
輸出結果為:
[1] 23rbinom函式從給定樣本生成所需數量的給定概率的隨機值,案例如下:
# Find 8 random values from a sample of 150 with probability of 0.4.
x <- rbinom(8,150,.4)

print(x)
輸出結果為:
[1] 58 61 59 66 55 60 61 67好啦,本次記錄就到這裡了。
如果感覺不錯的話,請多多點贊支援哦。。。