WPF 繪製圖表
在工作中經常會遇到需要將一組資料繪製成曲線圖的情況,最簡單的方法是將資料匯入Excel,然後使用繪圖功能手動生成曲線圖。但是如果基礎資料頻繁更改,則手動建立圖形可能會變得枯燥乏味。本篇將利用DynamicDataDisplay 在WPF 中動態模擬CPU 使用率圖表,實現動態生成曲線圖。
新建專案將DynamicDataDisplay.dll 載入到References 中,開啟MainWindow.xaml 新增名稱空間xmlns:d3="http://research.microsoft.com/DynamicDataDisplay/1.0"。通過<d3:ChartPlotter> 建立一個圖表框架,在其中新增兩條整型座標軸,X軸:<d3:HorizontalIntegerAxis>,Y軸:<d3:VerticalIntegerAxis>。<d3:Header> 用來設定圖表名稱,<d3:VerticalAxisTitle> 用來設定Y軸名稱。
<Window x:Class="WpfPerformance.MainWindow" xmlns="http://schemas.microsoft.com/winfx/2006/xaml/presentation" xmlns:x="http://schemas.microsoft.com/winfx/2006/xaml" xmlns:d3="http://research.microsoft.com/DynamicDataDisplay/1.0" Title="CPU Performance" Loaded="Window_Loaded" Height="350"Width="525"> <Grid> <Grid.RowDefinitions> <RowDefinition Height="Auto"/> <RowDefinition Height="*"/> </Grid.RowDefinitions> <StackPanel Orientation="Horizontal"> <TextBlock Text="CPU Usage" Margin="20,10,0,0"FontSize="15" FontWeight="Bold"/> <TextBlock x:Name="cpuUsageText" Margin="10,10,0,0" FontSize="15"/> </StackPanel> <d3:ChartPlotter x:Name="plotter" Margin="10,10,20,10" Grid.Row="1"> <d3:ChartPlotter.VerticalAxis> <d3:VerticalIntegerAxis /> </d3:ChartPlotter.VerticalAxis> <d3:ChartPlotter.HorizontalAxis> <d3:HorizontalIntegerAxis /> </d3:ChartPlotter.HorizontalAxis> <d3:Header Content="CPU Performance History"/> <d3:VerticalAxisTitle Content="Percentage"/> </d3:ChartPlotter> </Grid> </Window>

接下來工作需要通過C#每秒獲取一次CPU使用率,並將這些資料生成座標點(Point)繪製在圖表中。 以下是MainWindow.xaml.cs 部分的程式碼內容。
using System;
using System.Diagnostics;
using System.Windows;
using System.Windows.Media;
using System.Windows.Threading;
using Microsoft.Research.DynamicDataDisplay;
using Microsoft.Research.DynamicDataDisplay.DataSources;

namespace WpfPerformance
{
    public partial class MainWindow : Window
    {
        private ObservableDataSource<Point> dataSource = new ObservableDataSource<Point>();
        private PerformanceCounter cpuPerformance = new PerformanceCounter();
        private DispatcherTimer timer = new DispatcherTimer();
        private int i = 0;

        public MainWindow()
        {
            InitializeComponent();
        }

        private void AnimatedPlot(object sender, EventArgs e)
        {
            cpuPerformance.CategoryName = "Processor";
            cpuPerformance.CounterName = "% Processor Time";
            cpuPerformance.InstanceName = "_Total";

            double x = i;
            double y = cpuPerformance.NextValue();

            Point point = new Point(x, y);
            dataSource.AppendAsync(base.Dispatcher, point);

            cpuUsageText.Text = String.Format("{0:0}%", y);
            i++;
        }

        private void Window_Loaded(object sender, RoutedEventArgs e)
        {
            plotter.AddLineGraph(dataSource, Colors.Green, 2, "Percentage");
            timer.Interval = TimeSpan.FromSeconds(1);
            timer.Tick += new EventHandler(AnimatedPlot);
            timer.IsEnabled = true;
            plotter.Viewport.FitToView();
        }
    }
}
通過ObservableDataSource<Point> 動態儲存圖表座標點,PerformanceCounter 獲取CPU使用率數值,DispatcherTimer 計時器在規定間隔進行取數操作,整型i 作為CPU使用率座標點的X軸數值。
private ObservableDataSource<Point> dataSource = new ObservableDataSource<Point>();
private PerformanceCounter cpuPerformance = new PerformanceCounter();
private DispatcherTimer timer = new DispatcherTimer();
private int i = 0;
AnimatedPlot 事件用於構造座標點,通過設定cpuPerformance 相關引數,並使用NextValue() 方法獲取當前CPU使用率資料作為Y值,整型i 作為X值。將X、Y值構造為座標點(Point),並通過非同步方式儲存在dataSource 中。
private void AnimatedPlot(object sender, EventArgs e)
{
    cpuPerformance.CategoryName = "Processor";
    cpuPerformance.CounterName = "% Processor Time";
    cpuPerformance.InstanceName = "_Total";

    double x = i;
    double y = cpuPerformance.NextValue();

    Point point = new Point(x, y);
    dataSource.AppendAsync(base.Dispatcher, point);

    cpuUsageText.Text = String.Format("{0:0}%", y);
    i++;
}
最後通過Window_Loaded 將事件載入到<Window> 中,AddLineGraph 方法將dataSource 中的座標點繪製到圖表中,曲線顏色定義為綠色,粗細設定為2,曲線名稱為"Percentage"。設定計時器間隔為1秒,連續執行AnimatedPlot 事件實時繪製新座標點。
private void Window_Loaded(object sender, RoutedEventArgs e)
{
    plotter.AddLineGraph(dataSource, Colors.Green, 2, "Percentage");
    timer.Interval = TimeSpan.FromSeconds(1);
    timer.Tick += new EventHandler(AnimatedPlot);
    timer.IsEnabled = true;
    plotter.Viewport.FitToView();
}

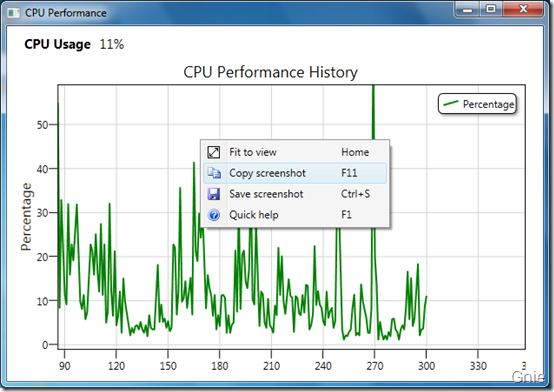
滑鼠右鍵可將圖表拷貝到其他文件:

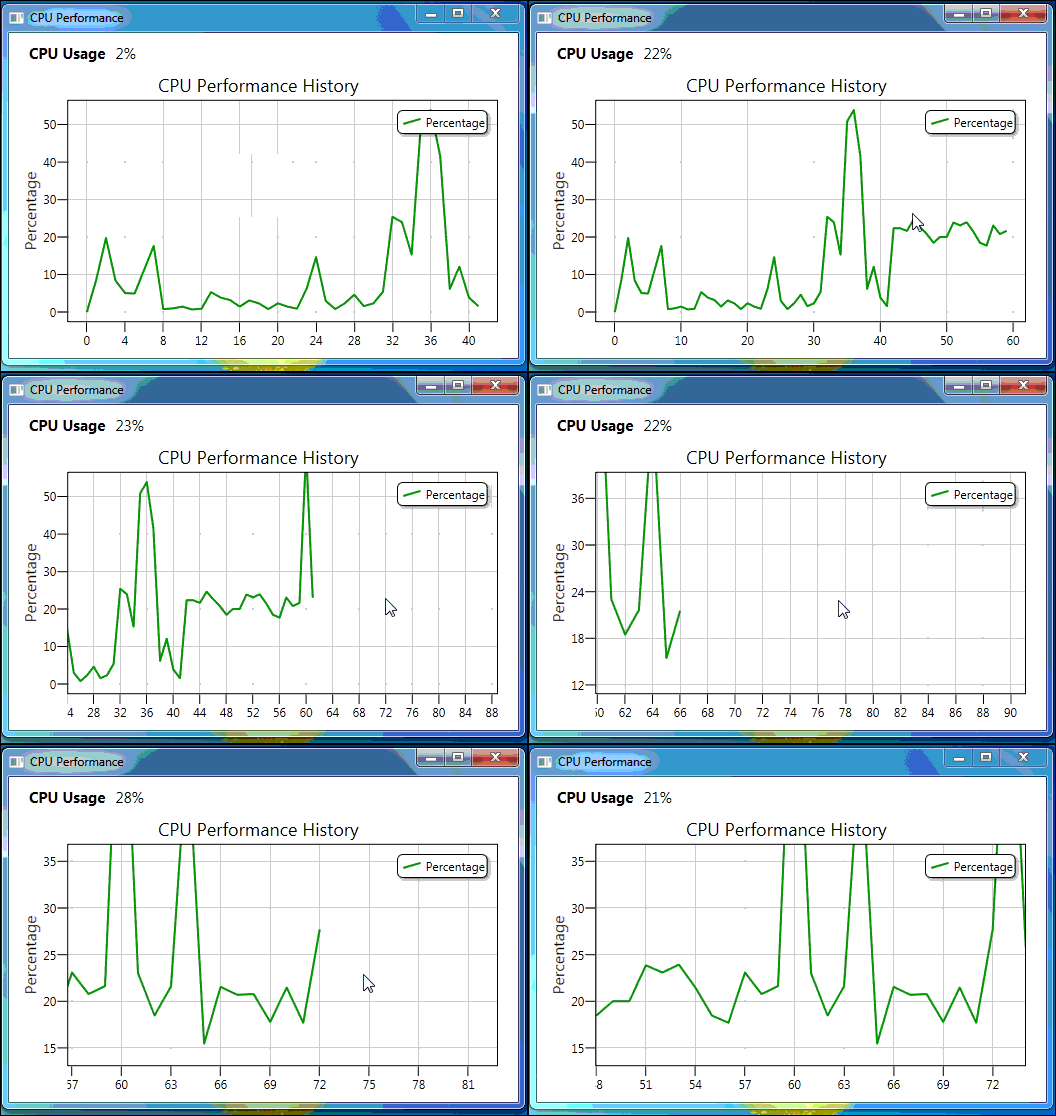
動態演示
滑鼠左鍵拖動圖表瀏覽任意位置曲線資料,滑鼠中鍵可以縮放顯示曲線圖。
原始碼下載
WpfPerformance.zip相關推薦
WPF 繪製圖表
在工作中經常會遇到需要將一組資料繪製成曲線圖的情況,最簡單的方法是將資料匯入Excel,然後使用繪圖功能手動生成曲線圖。但是如果基礎資料頻繁更改,則手動建立圖形可能會變得枯燥乏味。本篇將利用DynamicDataDisplay 在WPF 中動態模擬CPU 使用率圖表,實現動態生成曲線圖。 新建
如何使用Excel繪製圖表?
通過如何使用Excel進行資料分析,我們已經學會了從原始資料中得到分下面的分析結果:統計出每個城市的資料分析師招聘數量。 那麼,問題就來了。有了資料分析結果以後,如何展示成圖表呢? 我們按下面圖片中標出的
WPF 曲線圖表控件(自制)(一)
tac stack att tails wpf nts pan 黃色 pre 原文:WPF 曲線圖表控件(自制)(一) 版權聲明:本文為博主原創文章,未經博主允許不得轉載。 https://blog.csdn.net/koloumi/
WPF 曲線圖表控制元件(自制)(一)
原文: WPF 曲線圖表控制元件(自制)(一) 由於公司需要所以自寫了一個簡單的曲線圖表控制元件,在此分享。 先上一張效果圖 1.介面xaml X軸和Y軸用 2個line物件寫死在xaml上 外部用一個Grid包裹起來,然後X軸的寬度,和Y
WPF繪製一條不連續的線
WPF繪製一條不連續的線 繪製線應配合使用LineGeometry、GeometryGroup、System.Windows.Shapes.Path。核心流程是將各個LineGeometry新增到GeometryGroup中,然後通過Path.Data=group將之合併到一個Pat
grafana繪製圖表
安裝方法 系統為ubuntu16 1首先新增以下到/etc/apt/sources.list: deb https://packagecloud.io/grafana/stable/debian/ stretch main 2然後新增Package
Canvas 實現繪製圖表
這裡用canvas實現了兩個簡單的圖表,用到了canvas的基本用法,效果如下 新建 chart.js 檔案,封裝繪製方法 構造方法 function myChart(config){ this.width = config.width > 3
使用ReportLab繪製圖表練習
這個程式是《Python基礎教程》第21章的小練習。 這個程式主要做了這樣幾件事: 從指定連結獲取資料從指定連結獲取資料。 對資料進行簡單解析對資料進行簡單解析。 生成折線圖,以PDF輸出生成折線圖,
Win7,64位下Python 讀取csv檔案(Excel轉化的)並繪製圖表
參考程式碼: 依賴的包: 1.matplot 2.numpy Python 讀取csv檔案(Excel轉化的)並繪製圖表。 程式碼如下: from __future__ import print_function from matplotlib import mla
Python:使用matplotlib繪製圖表
今天看了一下使用python繪製圖表的方法,有個強大的類庫matplotlib,可以製作出高質量的2D和3D圖形,先記錄一下,以後慢慢學習。 幾個繪圖的例子,來自API手冊: 1、最簡單的圖: 程式碼: #!/usr/bin/env python impor
使用Python繪製圖表
一、圖形繪製 直方圖 import matplotlib.pyplot as plt import numpy as np mu = 100sigma = 20x = mu + sigma * np.random.randn(20000) # 樣本數量 plt.hi
Win7,64位下Python讀取Excel檔案並繪製圖表
1、安裝xlrd的whl檔案: Python讀取Excel使用xlrd,到官網https://pypi.python.org/pypi/xlrd下載xlrd-1.0.0-py3-none-any.whl安裝。 在C:\Program Files\Python
WPF繪製向量圖形模糊的問題
原文: WPF繪製向量圖形模糊的問題 WPF預設提供了抗鋸齒功能,通過向外擴充套件的半透明邊緣來實現模糊化。由於WPF採用了裝置無關單位,當裝置DPI大於系統DPI時,可能會產生畫素自動擴充套件問題,這就導致線條自動向外擴充套件一個畫素,並且與邊緣相鄰的線條顏色變成了半透明,如下圖所示: 這種特性在繪
React中使用highcharts繪製圖表emo
import React from 'react'; import Highcharts from 'highcharts'; export default class extends React.Component { componentDidMoun
Chart FX for WPF繪製地圖輪廓
Chart FX for WPF有著一個強大的功能:XYZExtension。這個功能將能夠使得我們在一個3D圖表上新增或控制第三個軸。個人覺得最新的這個SurfaceXYZ圖表最炫的功能就是創使用來自不同城市的資料建地理位置上精確的表面。這個功能可以用於很多的地方,比如說
使用matplotlib繪製圖表
我們先來看什麼是Figure和Axes物件。在matplotlib中,整個影象為一個Figure物件。在Figure物件中可以包含一個,或者多個Axes物件。每個Axes物件都是一個擁有自己座標系統的繪圖區域。其邏輯關係如下:
【Chart.js】通過Ajax請求JSON資料來繪製圖表
背景 在使用Chart.js繪製圖表時,我們通常會有這樣的需求:從後臺方法動態獲取圖表的資料,而非Demo中使用的靜態資料。本文將分享如何使用Ajax動態請求JSON資料並且完成圖表的繪製。 解決方案 在html頁中新增對Ch
matplotlib--python繪製圖表 | PIL--python影象處理
matplotlib庫 安裝方法:yum install python-matplotlib 或者 easy_install matplotlib 或者從
WPF繪製折線圖
繪製折線圖的函式如下: protected void DrawingLine(double drawwidth, double drawheight,double[] value,DateTime[] datetime) { dou
javascript 在客戶端繪製圖表系列二——柱圖
{ 70 barjg.drawLine(this.width+this.start_x,this.height+this.start_y+this.ArrowLength,this.width+this.start_x+this.ArrowLength,this.height+this.st

